Viewing waveforms, Viewing a waveform graph – E-Mon E-PS-S-HV-RTU User Manual
Page 178
Chapter 9 Viewing Files and Reports
Viewing Waveforms
178
PowerSmart Socket Power Quality Meter
Viewing Waveforms
Waveforms can be displayed in five different views: as
overlapped waveforms on a common time axis, individual
waveforms using separate time axes, as a cycle-by-cycle plot
of RMS values, as a frequency chart for voltage channels, and
as a harmonic spectrum in a graph or in a table view.
Each waveform window has a local toolbar from where you
can open another window to examine the waveforms in a
different view. When you move to another waveform record,
all views are updated simultaneously to reflect the changes.
You can open all five views together to analyze different
properties of the waveform like a wave shape, waveform
disturbance, unbalance, or spectrum.
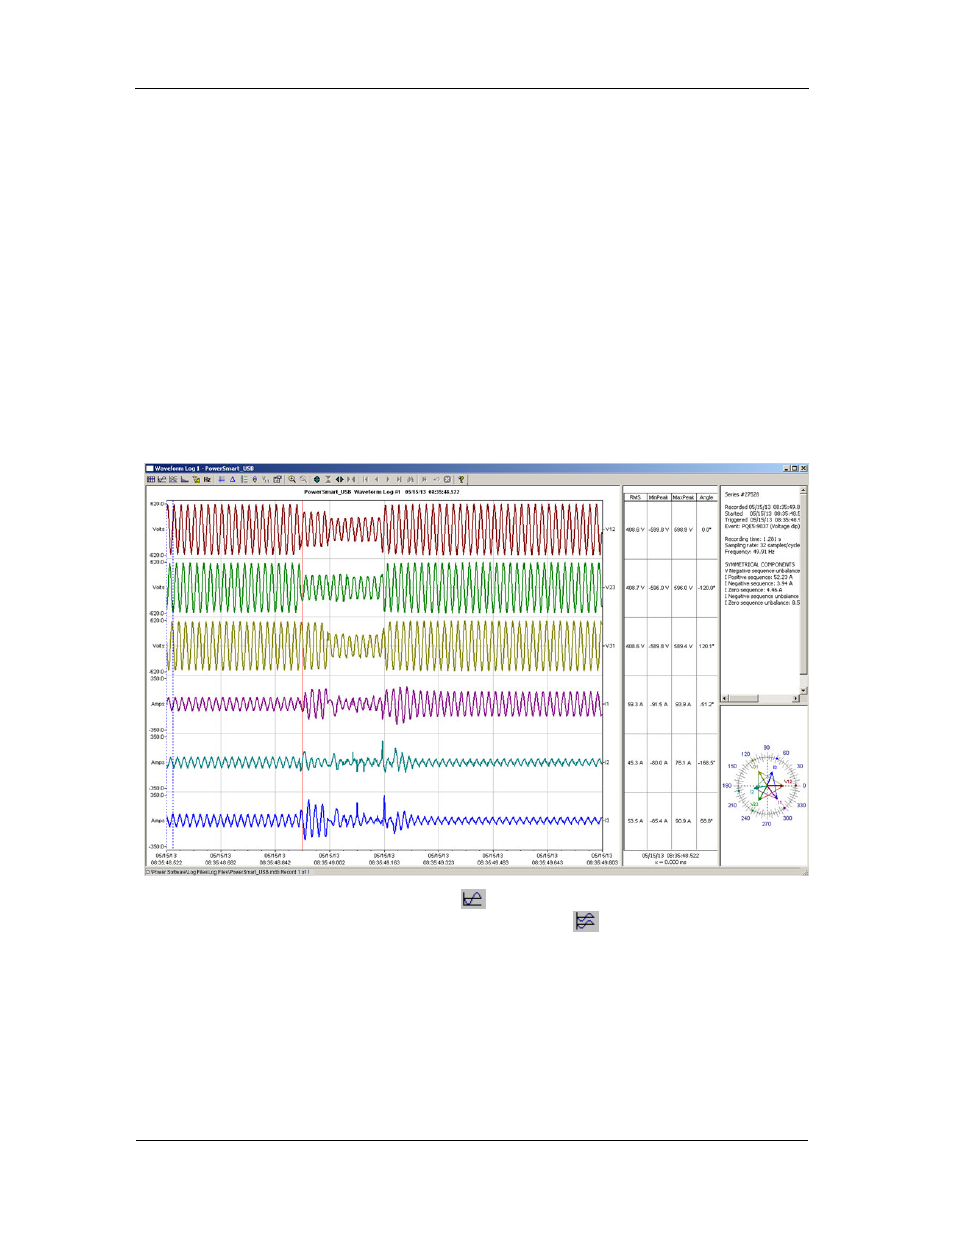
Viewing a Waveform Graph
When you open a new file, Power Software shows you a
waveform graph with non-overlapped waveforms.
Click on the
button on the local toolbar to see overlapped
waveforms; click on the
button for non-overlapped
waveforms.