Graphs – Magnum Venus Plastech Megaject RTM Pro Revison 7_0 User Manual
Page 34
Megaject RTM Pro Manual – Revision 7.00 – 13
th
APRIL 2006
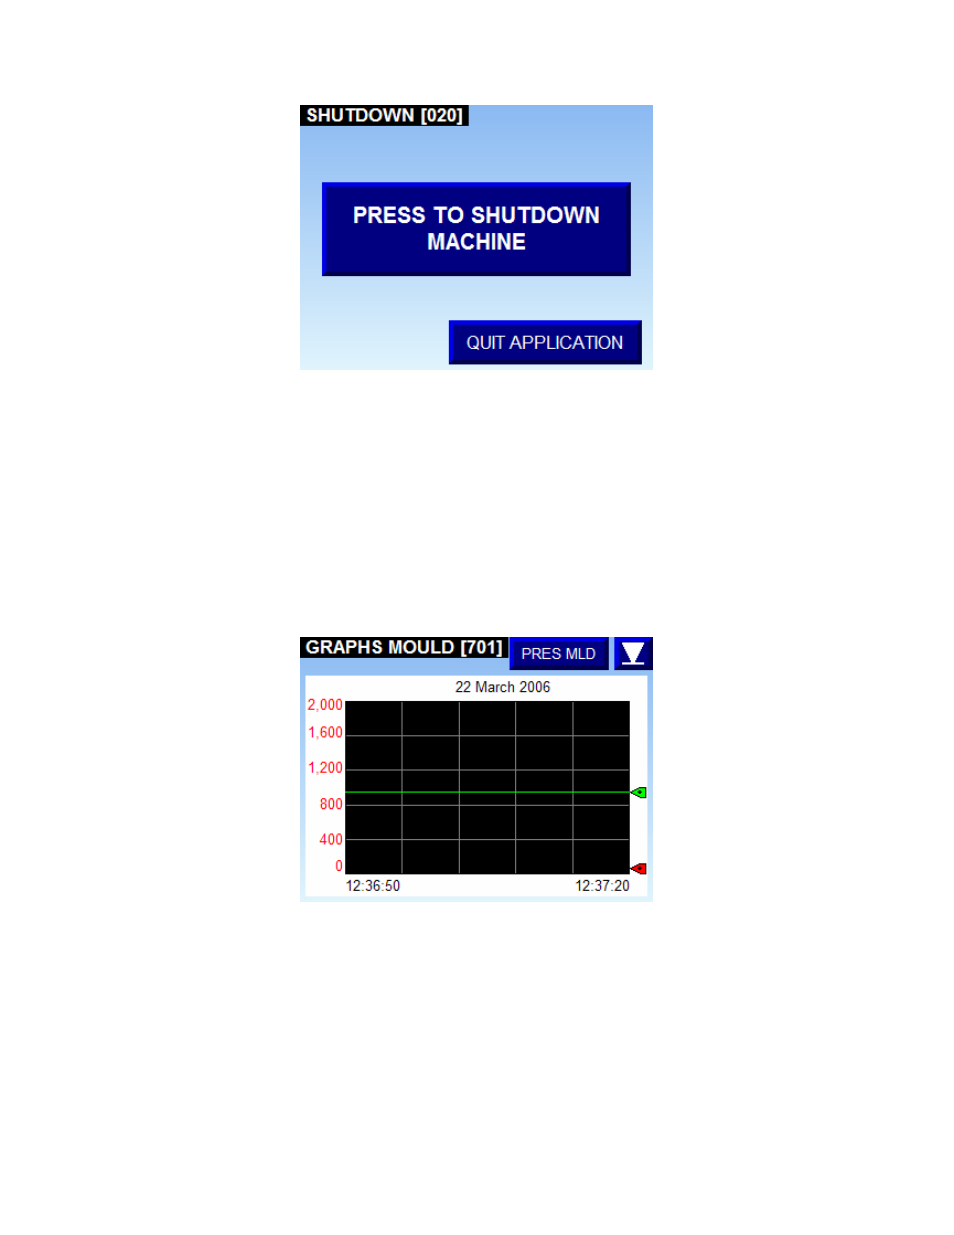
Figure 3.17 – Shutdown screen
4.12. Graphs
The graphs screens can be reached from any of the injection screens, and display a
different series of variables depending on whether the machine is in mould or head
pressure control modes.
The display for graphs, when the machine is in mould pressure control, is shown in
figure 3.18. The variables currently being displayed are specified on the button
positioned to the right, at the top of the screen. Pressing this button will advance to the
next set of variables, which can be displayed.
Figure 3.18 –Mould pressure mode graphs screen.
If two traces are displayed, the green line indicates a set point value, while the red line
shows the process variable in real-time.
For example, in mould pressure mode, the user has access to the followings graphs:
1.
Mould pressure & mould pressure set point
2.
Flow rate
3.
Catal & Catal threshold
4.
Head pressure
- PATRIOT 10:1 ADHESIVE SYSTEM (66 pages)
- PATRIOT PAT-CP-0550 (29 pages)
- PATRIOT 10 PAT-PH-10000 (34 pages)
- PATRIOT 7 PAT-PH-7000 Series (48 pages)
- PATRIOT 5 PAT-PH-5000 Series (42 pages)
- PATRIOT 4-1_4 PAT-PH-4250 (34 pages)
- PATRIOT 3-1_4 PAT-PH-3250 Series (36 pages)
- PATRIOT HV PAT-LS-49090 (33 pages)
- PATRIOT 1-3_4 PAT-LS-24050 (60 pages)
- PATRIOT 1-1_4 PAT-LS-12270 (66 pages)
- PATRIOT SS PAT-CCP-LS-0590-SS (30 pages)
- PATRIOT PAT-CCP-LS-0590 (42 pages)
- PATRIOT PAT-CP-3000 (28 pages)
- PATRIOT PAT-CP-1530 (32 pages)
- PATRIOT PAT-CP-0980 (29 pages)
- PATRIOT PAT-CP-0245 (32 pages)
- PATRIOT FIRST TIME START-UP CHECK LIST - Internal Mix (1 page)
- PATRIOT DAILY START UP - External Mix (1 page)
- PATRIOT DAILY START UP - Internal Mix (1 page)
- PATRIOT PRE-START CHECKLIST - External Mix (1 page)
- PATRIOT PRE-START CHECKLIST - Internal Mix (1 page)
- PATRIOT SET-UP - External Mix (1 page)
- PATRIOT SET-UP FOR CHARGEABLE - Internal Mix (1 page)
- PATRIOT Multi-Color Gel Coater MVE-PAT-1500-X (60 pages)
- PATRIOT TESTING & ADJUSTING (55 pages)
- PATRIOT DAILY SHUT DOWN CHECKLIST - External Mix (1 page)
- PATRIOT DAILY SHUT DOWN CHECKLIST - Internal Mix (1 page)
- PATRIOT SPRAY FAN SETUP - External Mix (1 page)
- PATRIOT SPRAY FAN SETUP - Internal Mix (1 page)
- PATRIOT FIRST TIME START-UP CHECK LIST - External Mix (1 page)
- UltraMAX VHPC-1100 Series (25 pages)
- UltraMAX VHPC-4200 Series (26 pages)
- UltraMAX VHPC-3200 Series (39 pages)
- UltraMAX VHPC-2200 Series (34 pages)
- UltraMAX VHPC-2000 Series (32 pages)
- UltraMAX VHPC-1200 Series (25 pages)
- UltraMAX VHPC-1000 Series (38 pages)
- UltraMAX MULTI–COLOR GELCOATER MVG-1400-X-1 (50 pages)
- UltraMAX MVP Installation & Set-Up (2 pages)
- UltraMAX Shut-Down Checklist (1 page)
- UltraMAX Start-Up Checklist (1 page)
- UltraMAX Pre-Start Checklist (1 page)
- UltraMAX Start-Up Sheet Quick List Instructions (1 page)
- UltraMAX Installation (1 page)
- UltraMAX HVLS-1000 Series (40 pages)