7 querying data, Querying data – Xylem WQL-Cond CONDUCTIVITY DATALOGGERS User Manual
Page 70
Working with the database and measurement data
WQL-Cond
166
ba75822e01
03/2011
9.7
Querying data
The data recorded by the logger and stored in the database can be displayed
as a graphic via the Query menu item. Proceed as follows:
Querying current
data
1
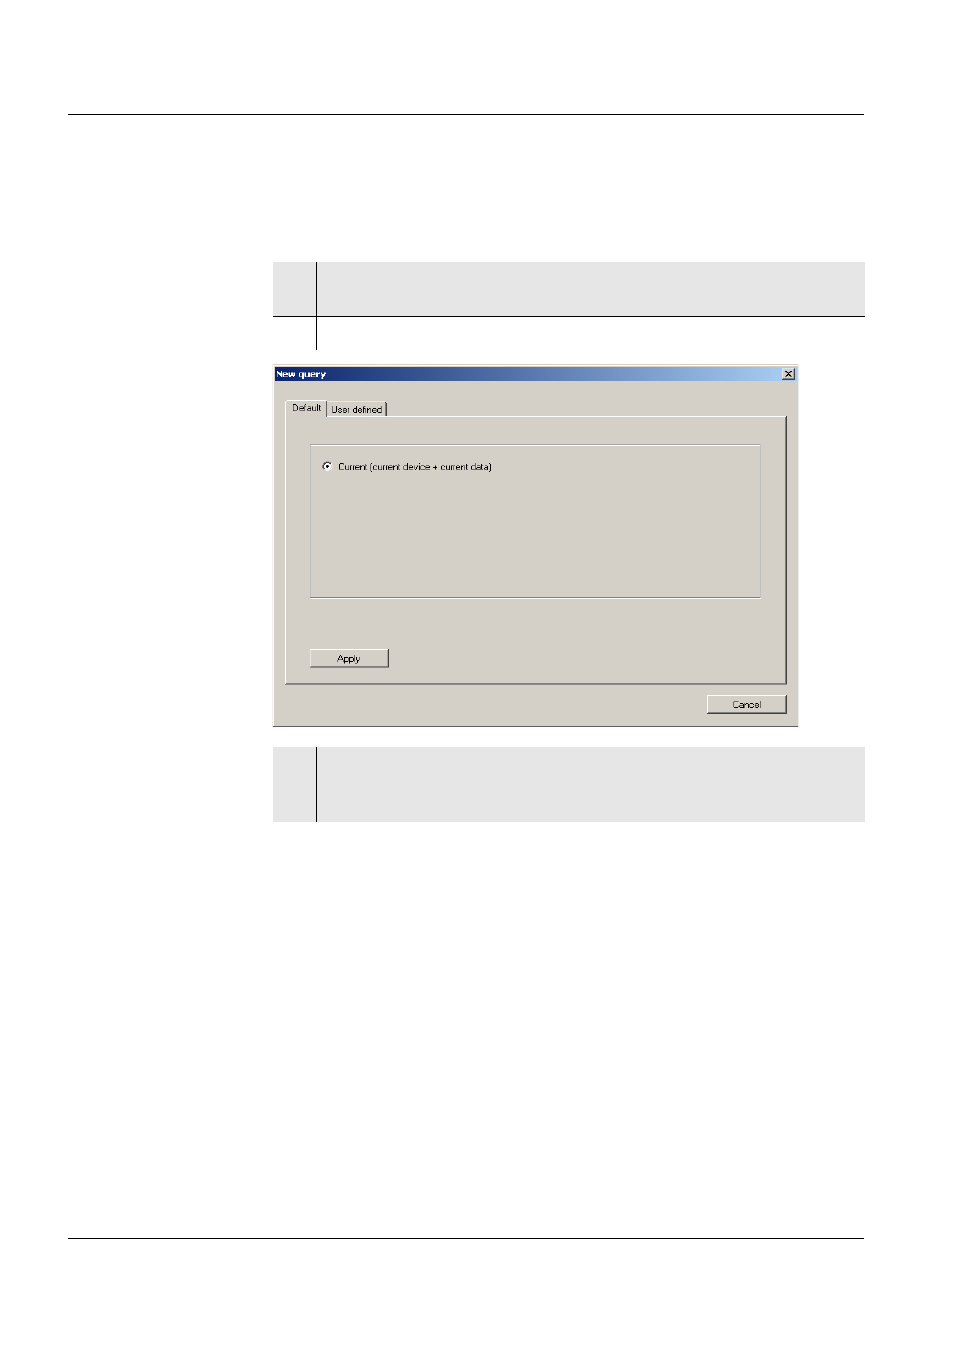
In the Query menu, click the menu item, New.
The New query window appears.
2
The Standard tab appears when a logger is connected.
3
To graphically display the data last imported from the connected
logger, click Apply. The data appear as a graphic, broken according
to conductivity value and temperature.