Ocean Optics ElliCalc User Manual
Page 32
Ocean Optics Germany GmbH Thin Film Metrology
31
It is possible to change any or these values by clicking on the first columns in the appropriate row. Then the
stage moves to that position and you are able to change it.
It is NOT possible to interchange or delete rows
.
7.3.2
Result List
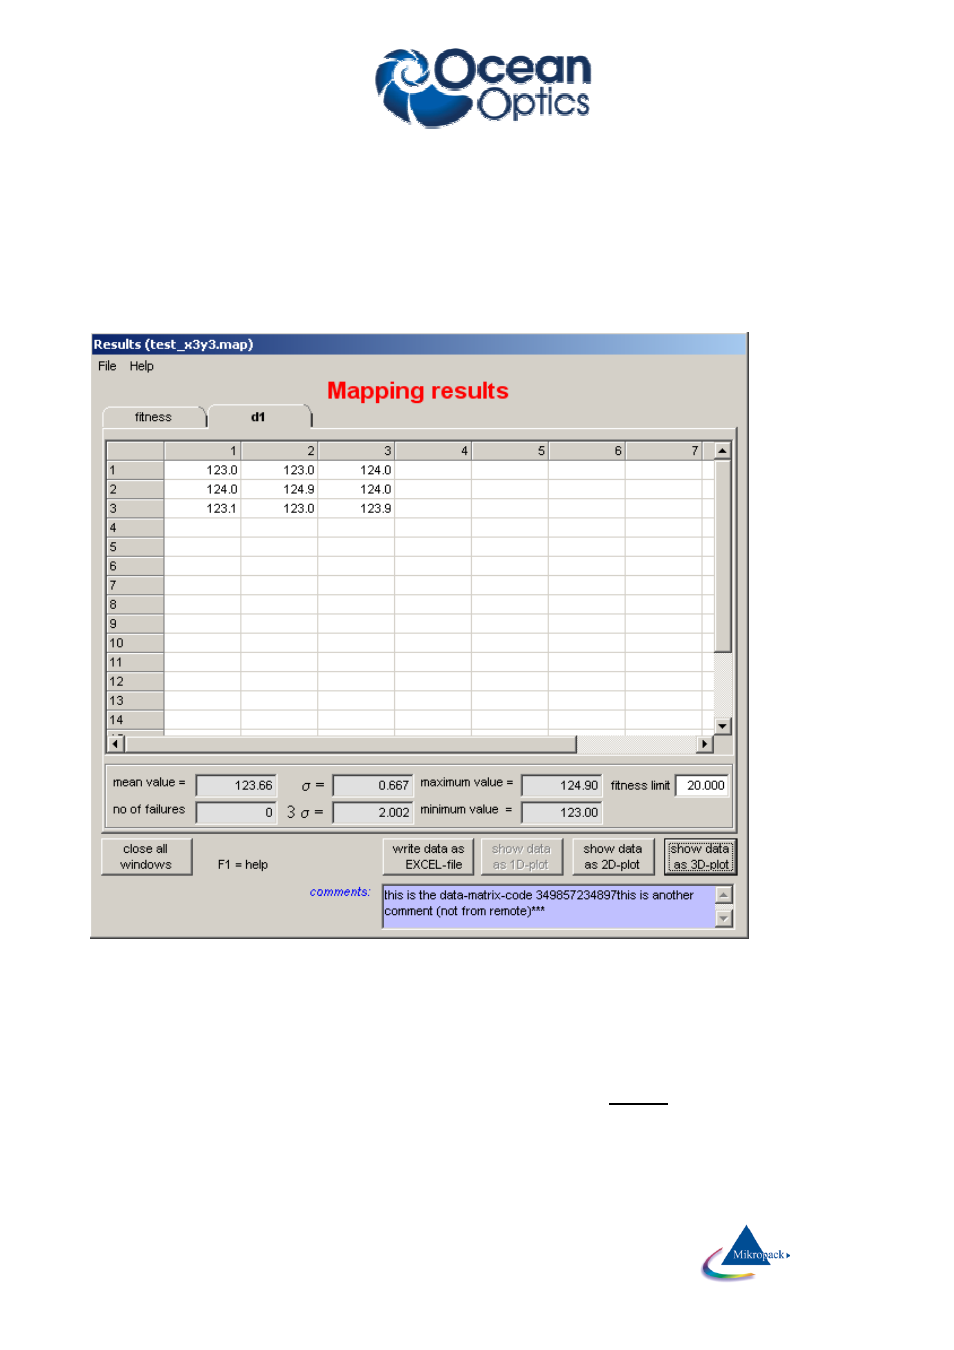
As soon as the mapping is finished you will see a result list:
On the first page you see the measured thickness values for each layer. In the picture above there was just
one layer and 3 x 3 = 9 measured data points. In the last page you can see the associated fitness values for
each coordinate. In the text windows below the data window you see mean values, maximum and minimum
values and standard deviation σ, the 3σ-value and the number of failures (according to the measured fitness
and your fitness limit).
If you did not choose a regular scan pattern, you will see a one-dimensional list.
If you click on the buttons with the numbers in a row or a column you will highlight a certain number of data
points (in the picture above column 3 was highlighted). Now you can control these selected values in a one-
or two-dimensional plot by pressing the appropriate button in the last row. You may also choose a smaller
amount of data by dragging with the mouse (e.g. 2 x 2 = 4 points).