7 trace window – Renesas Emulation Pod M306H7T3-RPD-E User Manual
Page 66
M306H7T3-RPD-E User’s Manual
3. Usage (How to Use the Emulator Debugger)
REJ10J0964-0100 Rev.1.00 August 01, 2005
Page 64 of 88
3.7 Trace Window
The trace window is used to show the results of real-time trace measurements.
(1) Trace window
1) Opening the hardware break point setup dialog box
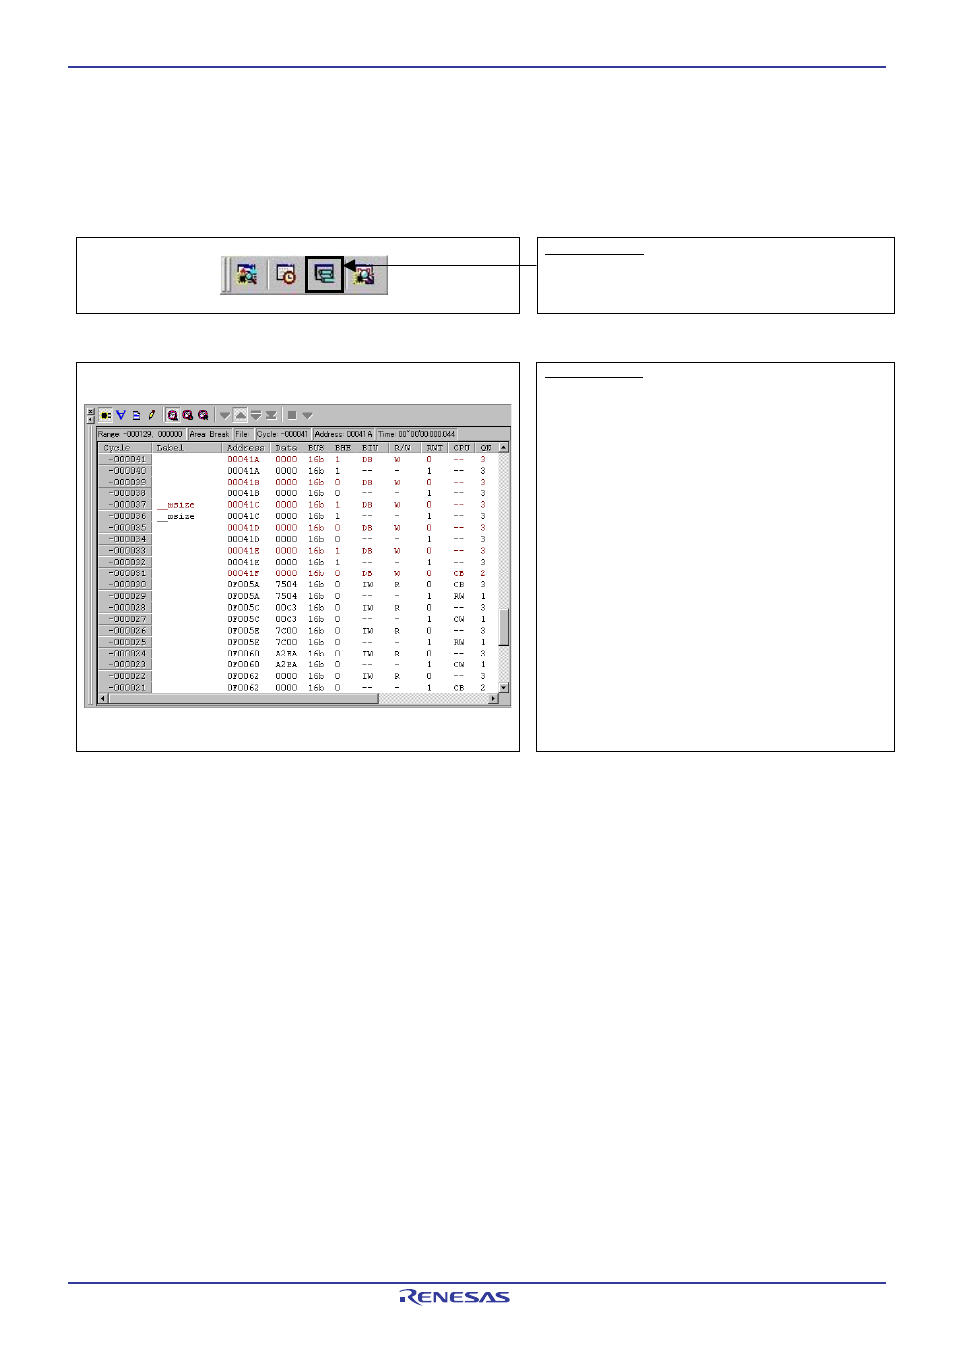
Trace window
Clicking this button opens the trace window.
2) Trace window
Trace window
The trace window is used to show the results of real-time trace
measurements. It has the following four display modes:
- Bus
mode
Bus information per cycle can be inspected. The contents are
displayed in order of execution paths.
- Disassemble
mode
The execution paths of the executed instructions can be
inspected. The contents are displayed in order of execution
paths.
- Data
access
mode
Data read/write cycles can be inspected
- Source
mode
The execution paths of the source program can be inspected.
The trace window shows the measurement result when a real-time
trace measurement has finished. The trace window remains blank
until the real-time trace measurement in progress finishes.