Statistics and other applications, Exporting statistics, Graph view methods – Nortel Networks 2500 Series User Manual
Page 27: Viewing statistics as graphs using the toolbar
Device Manager concepts
27
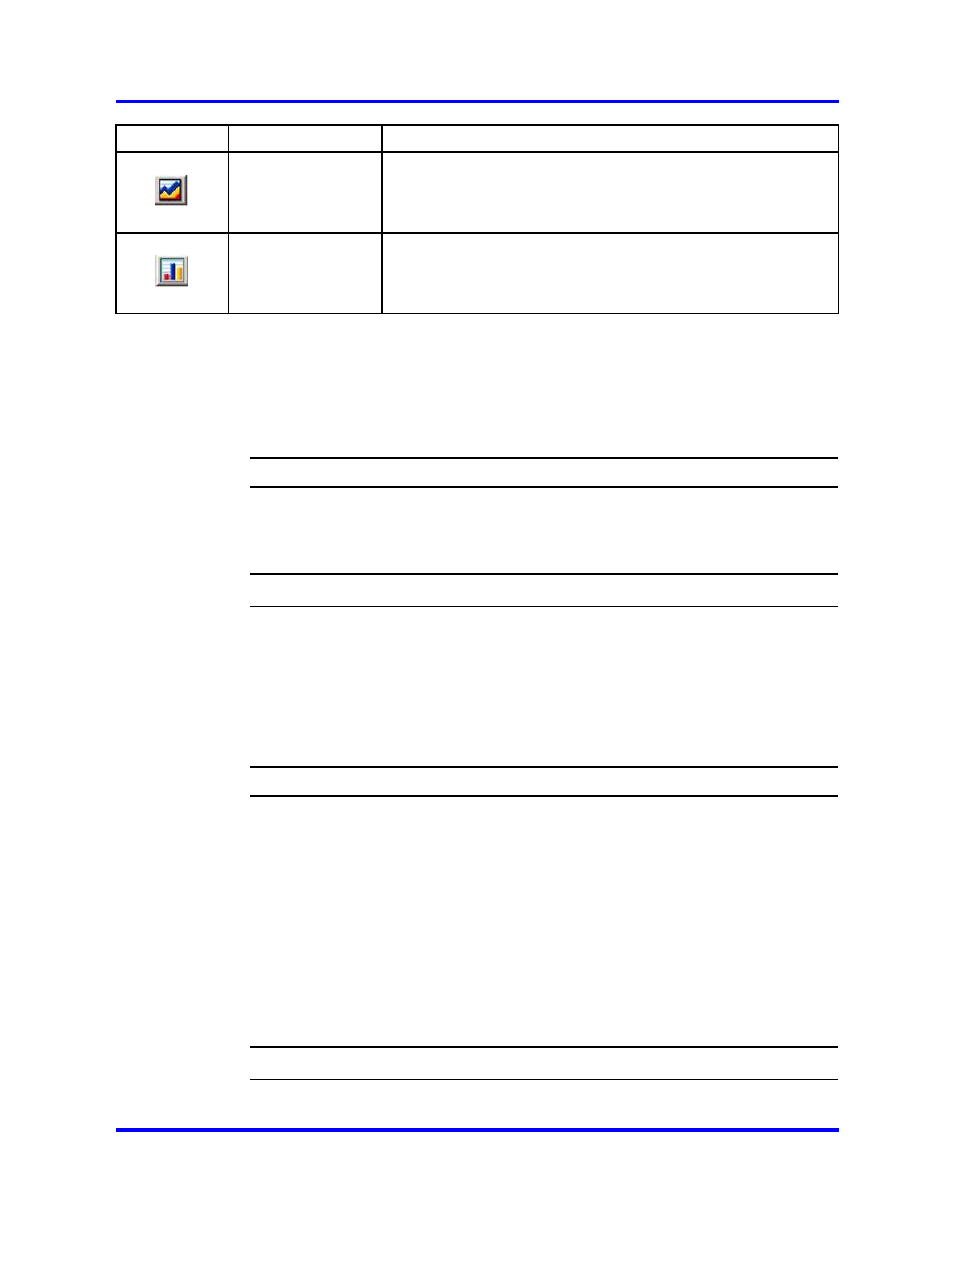
Button
Name
Description
Area Chart
Converts a line graph or bar graph to an area graph
Bar Chart
Converts a line graph or area graph to a bar graph
Statistics and other applications
Perform this procedure to export statistics to other applications.
Exporting statistics
Procedure Steps
Step
Action
1
To export statistics to a tab-separated file format and import that
file to other applications, click Export data at the bottom of the
Statistics window.
--End--
Graph view methods
You can view graphs from Device Manager statistics using the toolbar, the
shortcut menu, or the main menu.
Viewing statistics as graphs using the toolbar
Procedure Steps
Step
Action
1
Select the objects to graph.
2
On the toolbar, click Graph Selected.
3
From the Statistics window, select a statistics group tab to view.
4
On the data table, click and hold the right mouse button and drag
the pointer over the cells you want to graph. You selections must
reside in the same row or column.
5
Click one of the graph buttons at the bottom of the graph window
to select a graph type.
6
Click Print to print a copy of the graph.
--End--
Nortel Ethernet Routing Switch 2500 Series
Fundamentals
NN47215-102
01.01
Standard
27 October 2008
Copyright © 2008 Nortel Networks
.