Nortel Networks 2500 Series User Manual
Page 26
26
User interface fundamentals
Statistic
Description
AbsoluteValue
The total count since the last time the counters were reset.
A system restart resets all counters.
Cumulative
The total count since the statistics window was opened.
The elapsed time for the cumulative counter appears at the bottom of the
graph window.
Average/sec
The cumulative count for each polling interval.
Minimum/sec
The minimum average for the counter for each polling interval.
Maximum/sec
The maximum average for the counter for each polling interval.
LastVal/sec
The average for the counter during the previous polling interval.
Device Manager can create the following types of graphs:
•
line
•
area
•
bar
•
pie
Graph type selection buttons are located at the bottom of the Statistics
window.
You can use buttons at the top of the graph window change the
orientation, scale, or graph type.
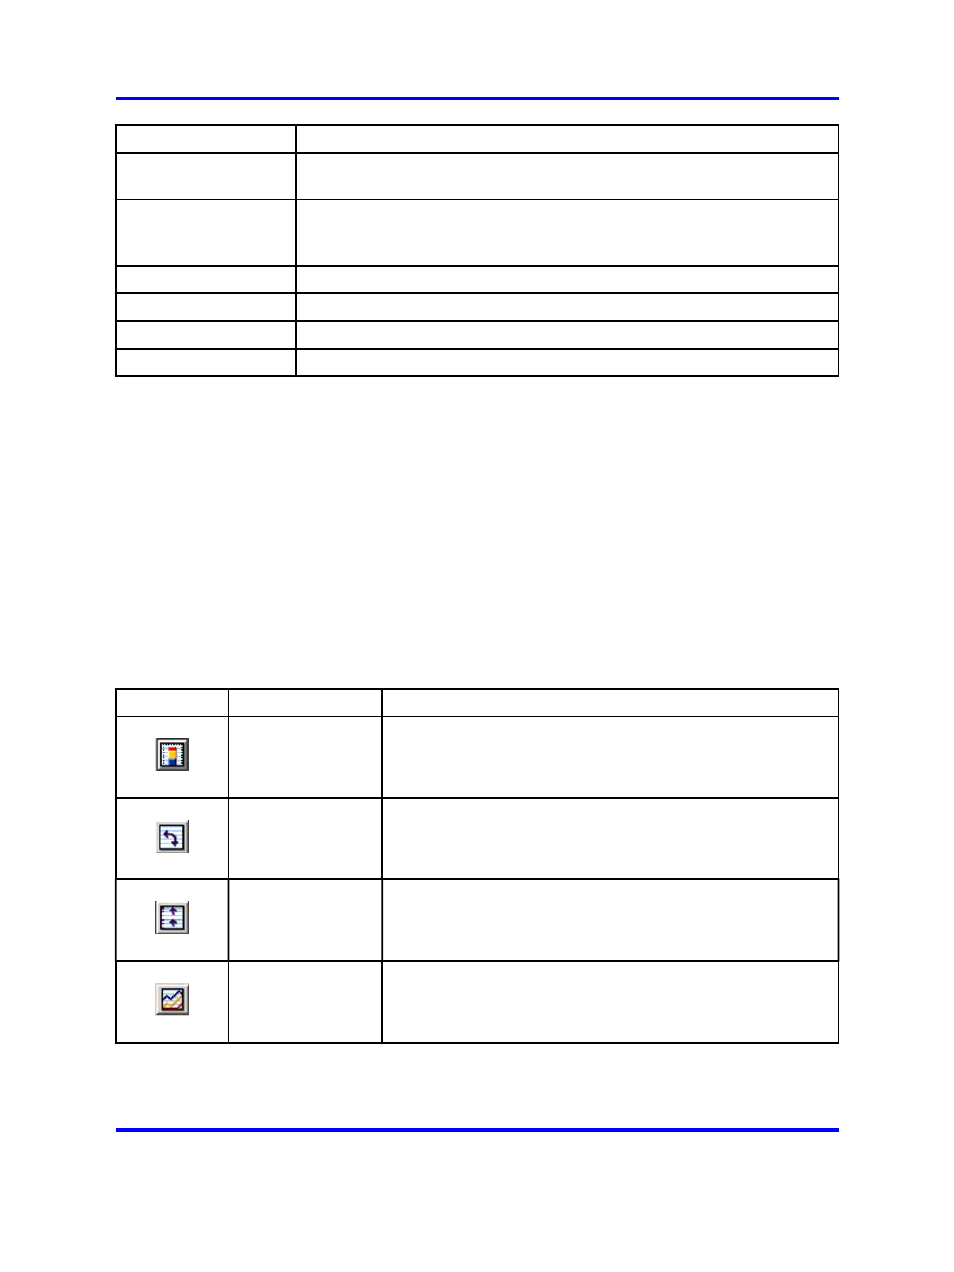
The following table describes the graph dialog box buttons.
Button
Name
Description
Stacked
Stacks data quantities instead of displaying them side-by-side
Horizontal
Rotates the graph 90 degrees
Log Scale
Changes the scale of the x axis from numeric to logarithmic
Line Chart
Converts an area graph or bar graph to a line graph
Nortel Ethernet Routing Switch 2500 Series
Fundamentals
NN47215-102
01.01
Standard
27 October 2008
Copyright © 2008 Nortel Networks
.