Debugging with the nodebuilder development tool – Echelon Mini EVK User Manual
Page 81
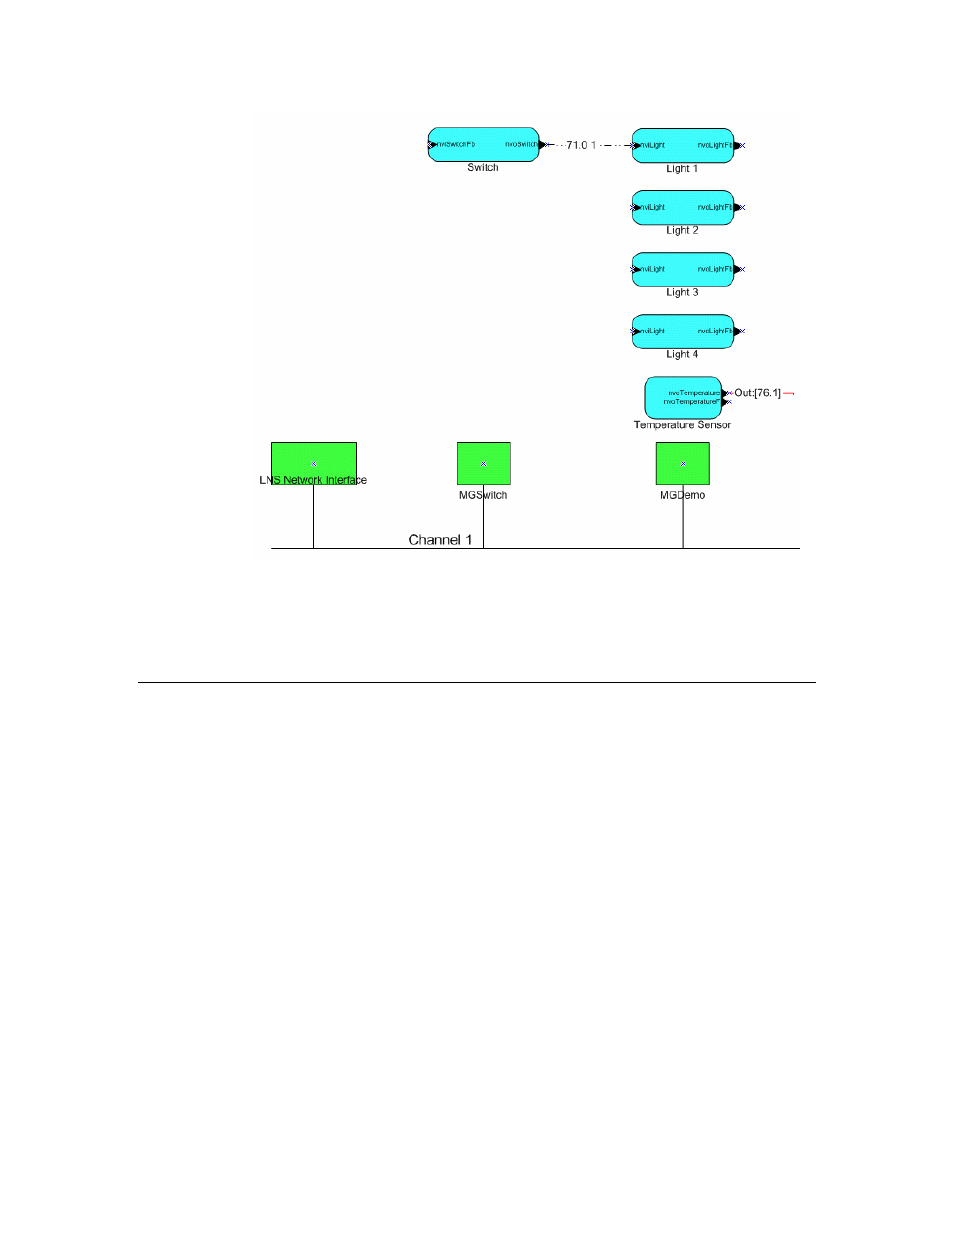
Figure 5.3 LonMaker Drawing with Connection Monitoring
You cannot simultaneously use the same network interface with both the
LonMaker tool and the Mini Application. See Using the Mini Application
with the LonMaker Tool section later in this chapter for information on using
the LonMaker tool with the Mini Application.
Debugging with the NodeBuilder Development Tool
You can use the NodeBuilder Development Tool to develop and debug Neuron
C applications. The NodeBuilder Development Tool includes a source-level
debugger for Neuron C, called the NodeBuilder debugger. The NodeBuilder
debugger allows you to control and observe your application’s behavior to
facilitate debugging. The debugger allows you to set breakpoints, monitor
variables, halt the application, step through the application, view the call
stack, and peek and poke memory. You can make changes to the code as you
debug and debug multiple devices simultaneously.
Following is an example window from the NodeBuilder debugger showing the
MGDemo example application stopped at a breakpoint upon completing a
reading from the temperature sensor. Once stopped at a breakpoint, you can
execute the application one step at a time to verify correct behavior and you
can monitor any of the variables in your application.
Mini EVK User’s Guide
75