Digital outputs, Drawing a state machine bubble diagram – Echelon LonPoint Application and Plug-In User Manual
Page 115
The LonPoint Application and Plug-in Guide
10-13
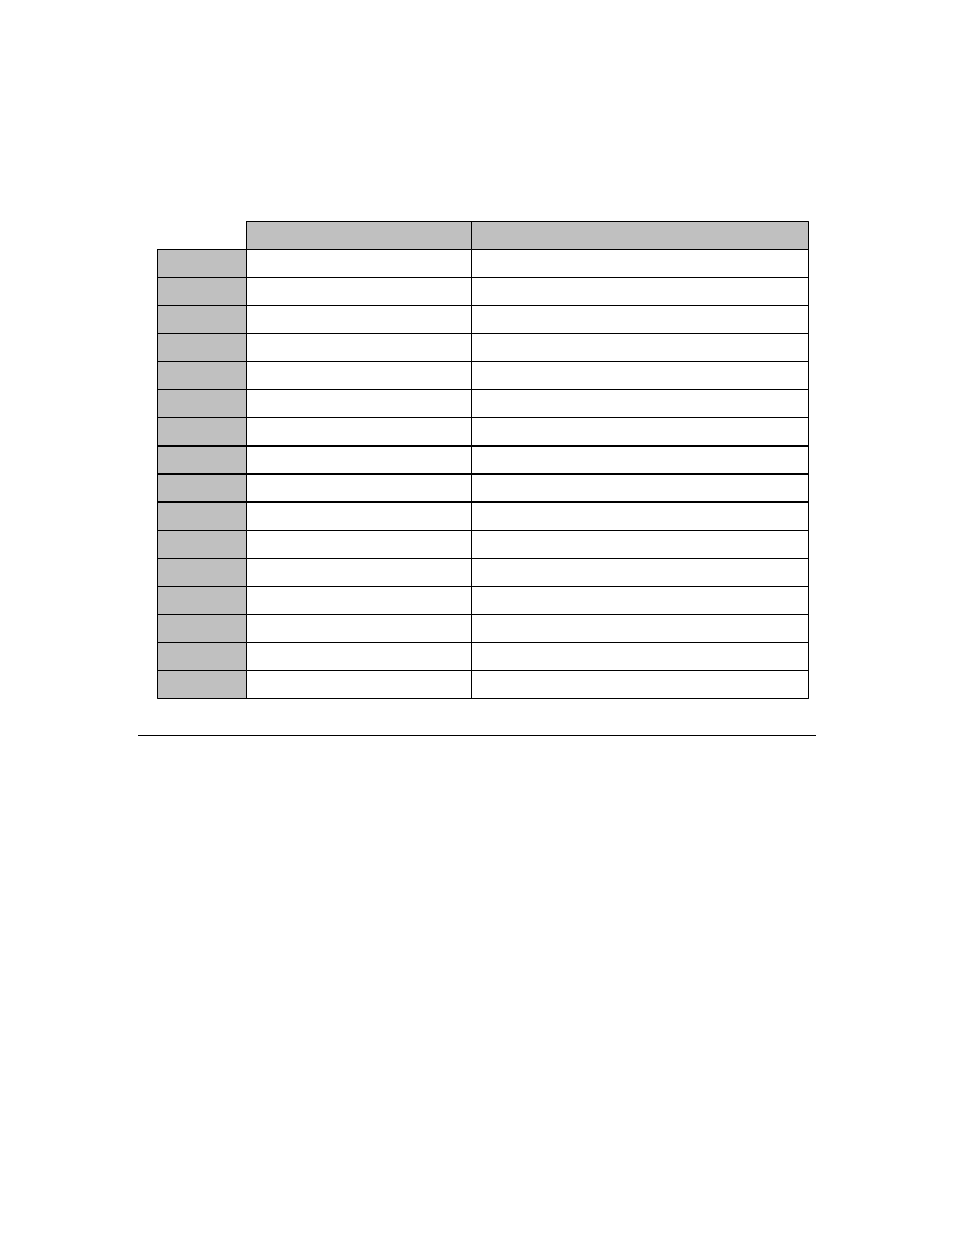
Following is an example of the Digital Outputs shape for a state output
schedule, with example names and descriptions.
oOccupied
For setpoint control
oSystemEnable
System enable
Digital Output Names
Optional Description and Type
D_Out_1
D_Out_2
D_Out_3
D_Out_4
D_Out_5
D_Out_6
D_Out_7
D_Out_8
Digital Outputs
D_Out_9
D_Out_10
D_Out_11
D_Out_12
D_Out_13
D_Out_14
D_Out_15
D_Out_16
Drawing a State Machine Bubble Diagram
A state machine bubble diagram defines one or more states and transitions for
the State Machine functional block. States are shown as bubbles on the
diagram, and transitions are shown as arrows between the states.
You will configure one of the states as the initial state. This state is the first
state selected by the State Machine functional block the first time a state
machine is executed.
States do not generate outputs, they instead define a set of exit conditions to be
monitored by the State Machine functional block. When an exit condition from
the current state becomes true, the State Machine functional block changes to
the next state defined for the transition associated with the exit condition, and
starts to evaluate the exit conditions for the new state. The selected transition
determines the outputs from the State Machine functional block.
For example, you may have one transition between stOff and stOccupied that
occurs when the system is enabled and the outdoor air temperature is hotter
than the indoor air temperature. This transition may put the system into
cooling mode. A second transition between stOff and stOccupied may occur