ALTANA Auto-Chart User Manual
Page 16
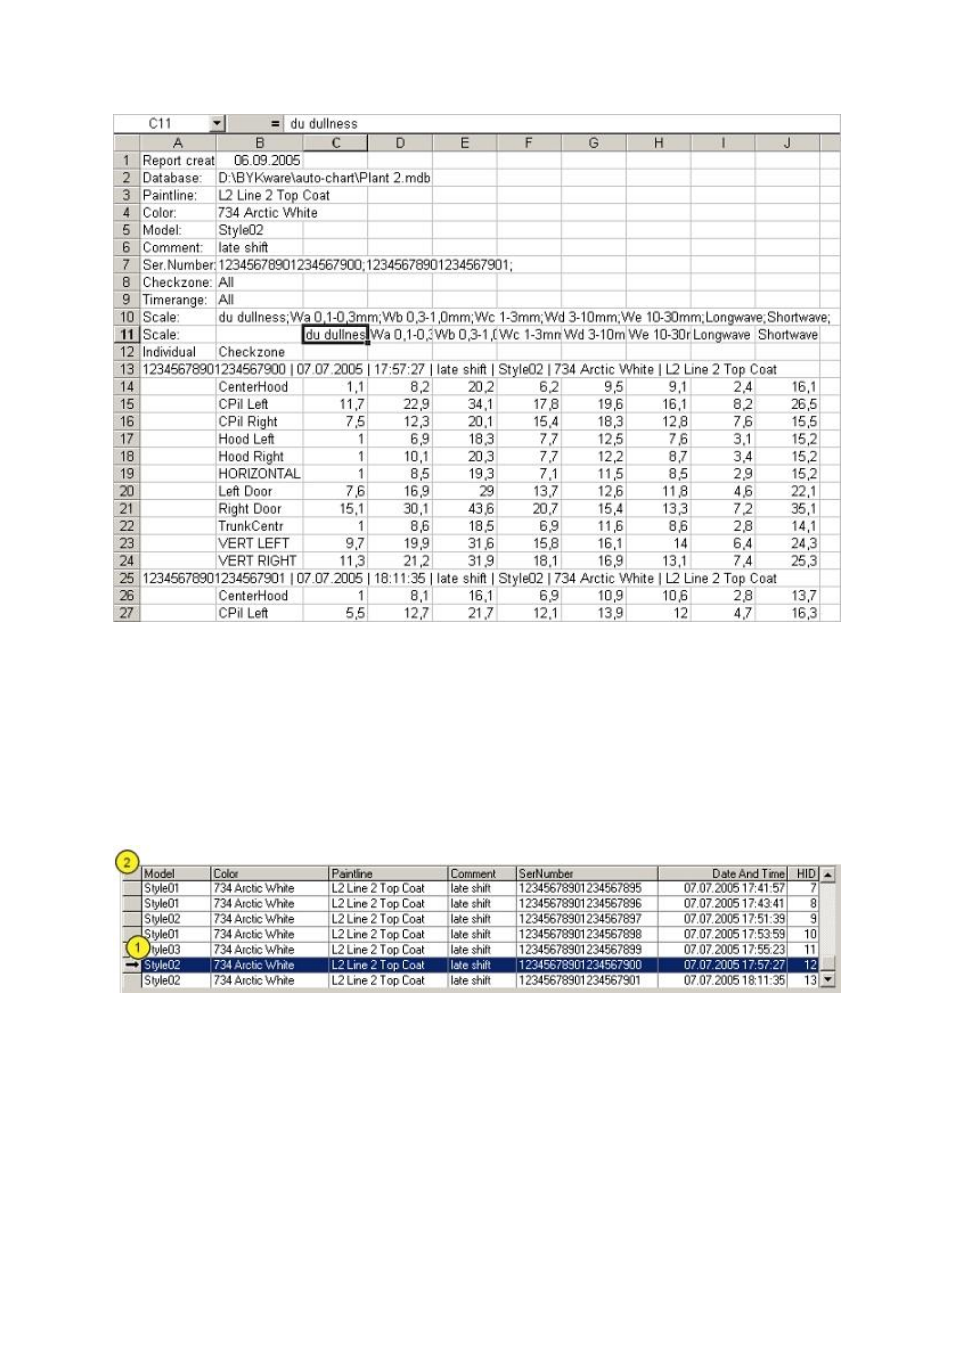
Note: The layout of the data in Excel can be changed by using the Pivot function.
注意:数据在 Excel 表格中的摆放能通过枢轴函数更改。
Selection of individual datasets:
特定数据组的选择:
Use the button "Filter Result" (6) of the "Open Data" window to display a list of all the records
according to your filter criterions:
使用“打开数据”中的“筛选结果”按钮 (6) ,窗口显示按您筛选条件的全部结果。
Note: If the same object was measured with several instruments, e.g. wave-scan and BYK-mac,
every dataset is listed as a separate record.
注意:如果相同的物体使用不同的仪器测量,如:桔皮仪和 BYK-mac 多角度测色仪,每一个数组
作为单独记录列出。
Move the cursor to the left side of the desired row until it changes to a black arrow (1) and click the
left mouse button. Now press the "Show Data" button (5), to transfer the measurement data to
Excel.
将光标移至表格左侧需要的行上当光标变为黑色箭头 (1) 时点击鼠标左键。点击“显示数据”按钮
(5), 传输数据到 Excel 表。
- Micro-Gloss Short Instructions (2 pages)
- Micro-Gloss Manual (57 pages)
- Micro-TRI-Gloss μ (174 pages)
- Micro-Haze Plus (116 pages)
- Haze-Gloss Manual (128 pages)
- Haze-Gloss Short Operating Instructions (2 pages)
- Cloud-Runner Manual (57 pages)
- Cloud-Runner Short Instructions (2 pages)
- Wave-Scan Dual Operating Instructions (188 pages)
- Wave-Scan Short Instructions (2 pages)
- Micro-Wave-Scan Manual (62 pages)
- Micro-Wave-Scan Short Instructions (2 pages)
- Auto-Chart (204 pages)
- Haze-Gard Plus Operating Instructions (180 pages)
- Haze-Gard Plus Short Instructions (2 pages)
- Haze-Gard Dual (164 pages)
- Byko-Spectra Mini (78 pages)
- Byko-Spectra Effect Short Instructions (2 pages)
- Byko-Spectra Basic (78 pages)
- Liquid Color Standards Manual (10 pages)
- Liquid Color Standards Safety Instructions (40 pages)
- Liquid Color Standards Short Instructions (2 pages)
- LCS IV (113 pages)
- LCM plus (23 pages)
- LCS III (370 pages)
- LCM III (234 pages)
- BYK-mac i ROBOTIC Manual (26 pages)
- BYK-mac i Manual (61 pages)
- BYK-mac i Short Instructions (2 pages)
- BYK-mac Manual (61 pages)
- BYK-mac Manual (64 pages)
- BYK-mac Safety Instructions (40 pages)
- BYK-mac Short Instructions (2 pages)
- BYK-mac Short Instructions (2 pages)
- BYK-mac ROBOTIC Manual (26 pages)
- BYK-mac Link (2 pages)
- 6330 (26 pages)
- Color-View (75 pages)
- Spectro-Guide 45/0 Gloss Manual (74 pages)
- Spectro-Guide (2 pages)
- Easy-Link Color-Sample-Link (2 pages)
- Easy-Link Color-Standard-Link (2 pages)
- Abrasion Tester (30 pages)
- Gardner-Scrub Manual (17 pages)