Checkline TI-MVX User Manual
Page 40
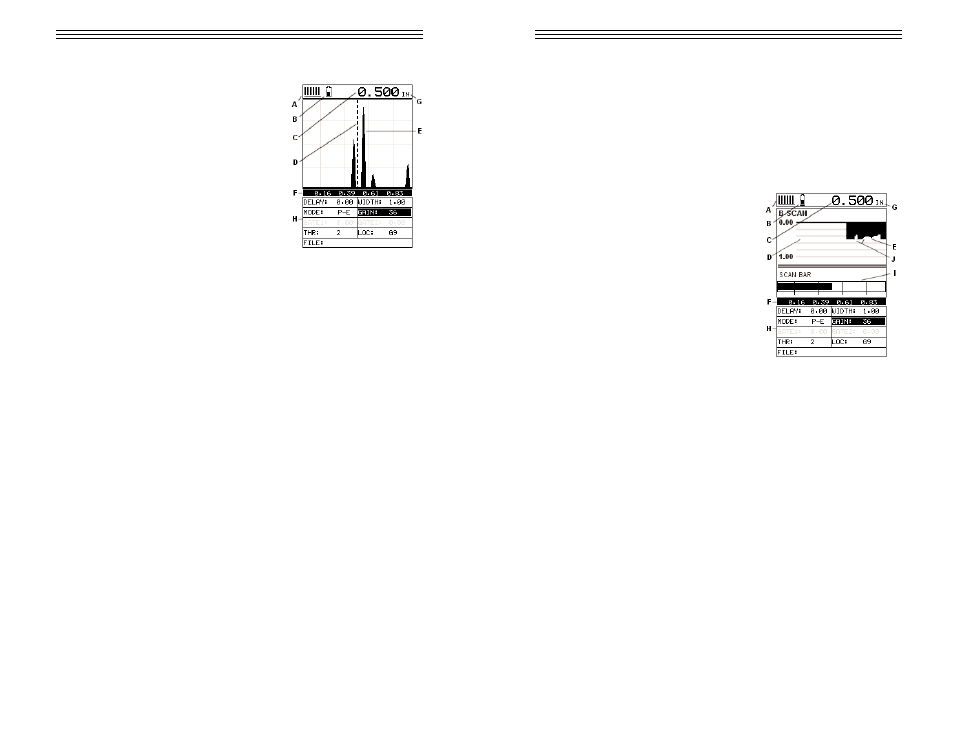
Rectified View
The rectified A-Scan mode shows half of the
waveform. Either the positive or negative
peaks are displayed, depending on the polar-
ity selected. This is the preferred display view
for flaw and pit detection applications.
It’s important to note that a measurement
must fall inside the viewable display range in
order to see the waveform. However, even if
the waveform is outside of the viewable area,
a measurement can be taken and viewed on
the digital readout. If the waveform is outside
of the display range, you can manually
change the range by adjusting the Delay and
Width values, or you can use the Auto Find
feature located in the UTIL menu in the
tabbed menu items. Refer to page 58 for additional information on the Auto Find
feature.
The following is a list of the viewable features on the display:
A) Stability of Reading Indicator – Indicates the stability of the return echo on a
scale of 1 to 6 – the solid bars displayed in the figure above indicate a repeat-
able signal. If the TI-MVX is displaying a reading from memory, the repeatability
indicator will be replaced by the text “MEM”.
B) Battery life indicator – Fully charged batteries will appear filled in solid. Note:
The diagram shows the batteries at approximately 50%.
C) Thickness reading – Digital readout of thickness (inches or millimeters).
D) Detect Indicator – The broken vertical line displays the zero crossing (flank)
detection point on the waveform where the measurement has been obtained.
Notice that the digital thickness readout is the same as the location of the detect
indicator according to the measurements labels F, also in the diagram.
E) Echo Signal – Graphical full waveform representation of the return echo dis-
played as an amplitude (vertical or “Y” axis) plotted against time (horizontal or
“X” axis), this time is then converted to a physical measurement.
F) Measurement Labels – The measurement labels are calculated and displayed
according to where the left side of the display has been set (Delay), and the
overall viewable area (Width) of the display. Note: The gray hash marks break
the display up into 5 segments, or quadrants. The measurement labels corre-
spond to the measurement at each hash mark.
-40-
G) Units Label -Displays the current units of measurement (inches or millime-
ters).
H) Hot Menus -Each of the fields located under the waveform display are called
the Hot Menu Fields. These fields allow quick control of some of the fine adjust-
ments needed to control the display settings, measurement modes, and grid
memory control. All of these fields can be adjusted without having to activate the
tabbed menu items and searching through a variety of menus to make adjust-
ments.
B-Scan View
The B-Scan displays a time based cross
section view of test material. This view is
commonly used to display the contour of
the blind, or underside, surface of a pipe or
tank application. It is very similar to a fish
finder. If a flaw or pit is located during a
scan, the B-Scan will draw the pit on the
screen. The solid black rectangle in the
diagram at location E represents the cross
section, or side view of the material. You
will notice that the overall thickness of the
material is .500”, and the display range is
0.00” to 1.00” respectively. The B-Scan
view draws at a rate of 15 seconds per
screen from right to left. Also notice at
location J, the pits and corroded bottom
surface of the material.
It’s important to note that the measurement range on the display be set wide
enough, so that the maximum thickness of the material can be viewed on the
display. Using the diagram above, if the material thickness was actually 1.75”,
the underside of the material would not be viewable according to the current
range at 0.00” – 1.00”. All the user would see is a black screen from 0.00” –
1.00” with no view of the bottom contour at 1.75”.
The following is a list of the viewable features on the display:
A) Stability of Reading Indicator – Indicates the stability of the echo signal on a
scale of 1 to 6 – the solid bars displayed in the figure above indicate a repeat-
able signal. If the TI-MVX is displaying a reading from memory, the repeatability
indicator will be replaced by the text “MEM”.
B) Battery life indicator – Fully charged batteries will appear filled in solid. Note:
The diagram shows the batteries at approximately 50%.
-41-