Elecraft PX3 Owner's Manual User Manual
Page 21
21
panadapter is a powerful tool for tracking down
interference.
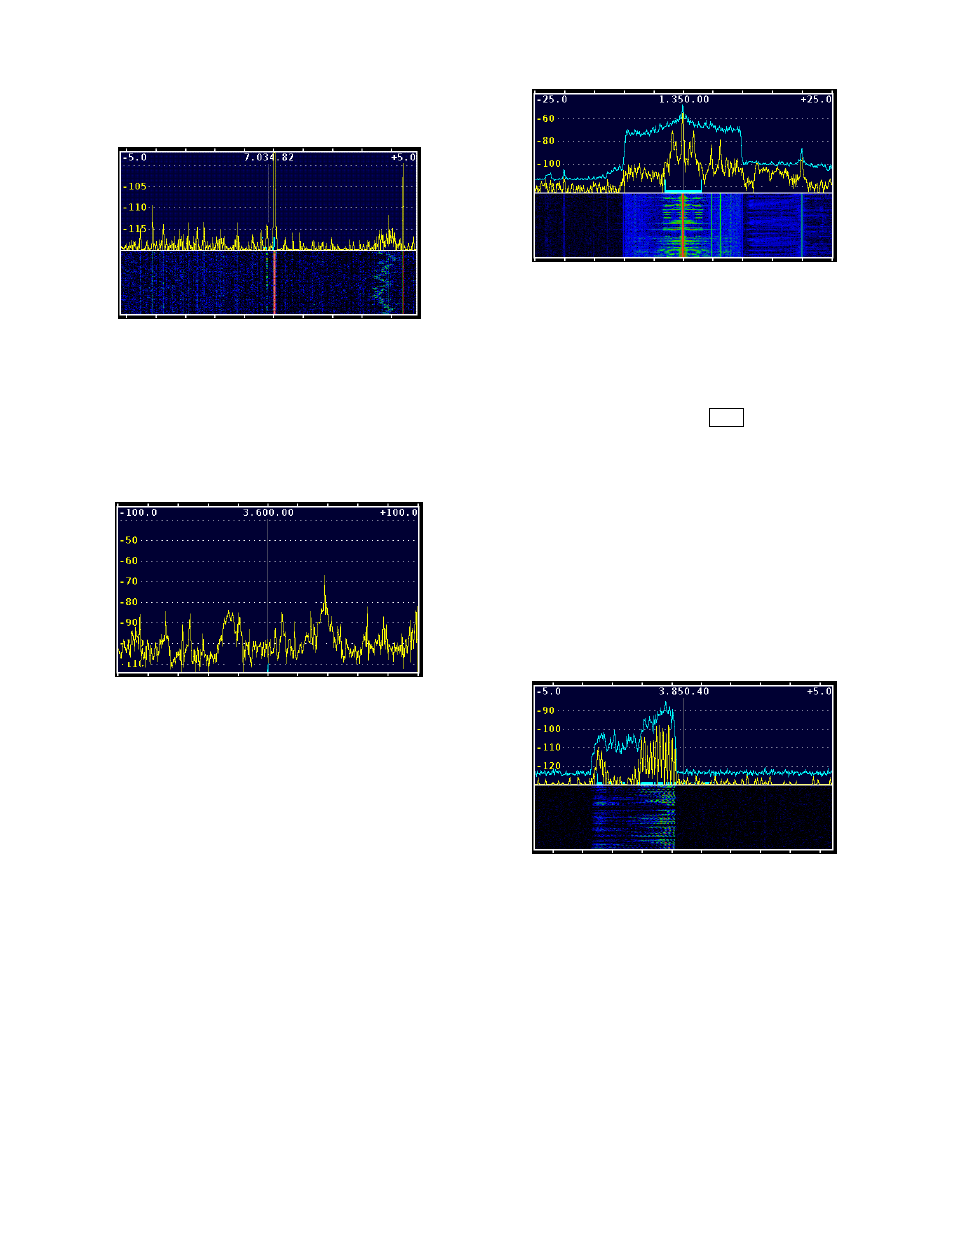
Figure 13. Typical Spectra Display.
Figure 14
is another example of interference, this
time from a LAN router. The QRM includes both
wideband noise as well as discrete carriers and is
constantly heaving and writhing as the processor in
the router executes different portions of its software
routines.
Figure 14. Typical Interference Display.
Spurious signals generated in the transceiver are
sometimes visible as well. As you tune the
transceiver you may see carriers that scroll across
the screen much faster than other signals,
sometimes tuning in the opposite direction. These
are created by high-order harmonics of the VFO,
BFO and other signal sources in the transceiver.
Normally you won’t hear them in the receiver
unless one falls within the passband, but they are
easy to see on the panadapter display because of its
much wider bandwidth.
Figure 15
is a shot of a local AM broadcast station,
illustrating the use of peak hold to show the shape
of the modulation spectrum, which extends to plus
and minus 10 kHz from the carrier and then drops
off abruptly to meet FCC regulations.
Figure 15. Typical AM Spectra using Peak Hold.
Normally the PX3 display is frozen while the KX3
is transmitting. However if you temporarily
disconnect the
ACC1
cable between the PX3 and
KX3, that function is disabled and it is possible to
view your own transmissions for test purposes. You
may need to experiment with
R E F
on the PX3 and
the power level and on the KX3 to properly display
the signal.
Figure 16
shows a typical LSB spectrum obtained in
this way. Peak hold is enabled in order to get a
better view of the spectrum shape. Notice that the
low audio frequencies (on the right) are much
stronger than the high audio frequencies. A flatter
spectrum is considered desirable to improve the
signal’s “punch” in the presence of noise and
interference, especially when speech compression is
used. The PX3 is a handy tool for adjusting the
transmit equalizer in the KX3.
Figure 16. Typical SSB Spectra using Peak Hold.
Figure 16
also illustrates an important point when
using markers. On SSB, the frequency that is shown
on the display of the KX3 transceiver is the
suppressed carrier frequency. When you QSY the
transceiver using MKR A or MKR B on the PX3,
where the marker is set is the frequency the KX3
will go to. So on bands where LSB is used, you
should place the marker just above the spectrum of
the SSB signal you are trying to net (approximately
in the center of the above display) and for USB,
place the marker just below the spectrum.