Graph san resource usage, 118 graph san resource usage – Apple Xsan 2 User Manual
Page 118
If you don’t see the storage pools for a volume, click the volume’s disclosure triangle.
From the command line
You can also check volume free space using the
cvadmin stat
command, and you
can check storage pool free space using the
cvadmin show
command. For information,
see the
cvadmin
man page or “View or change volume and storage pool settings
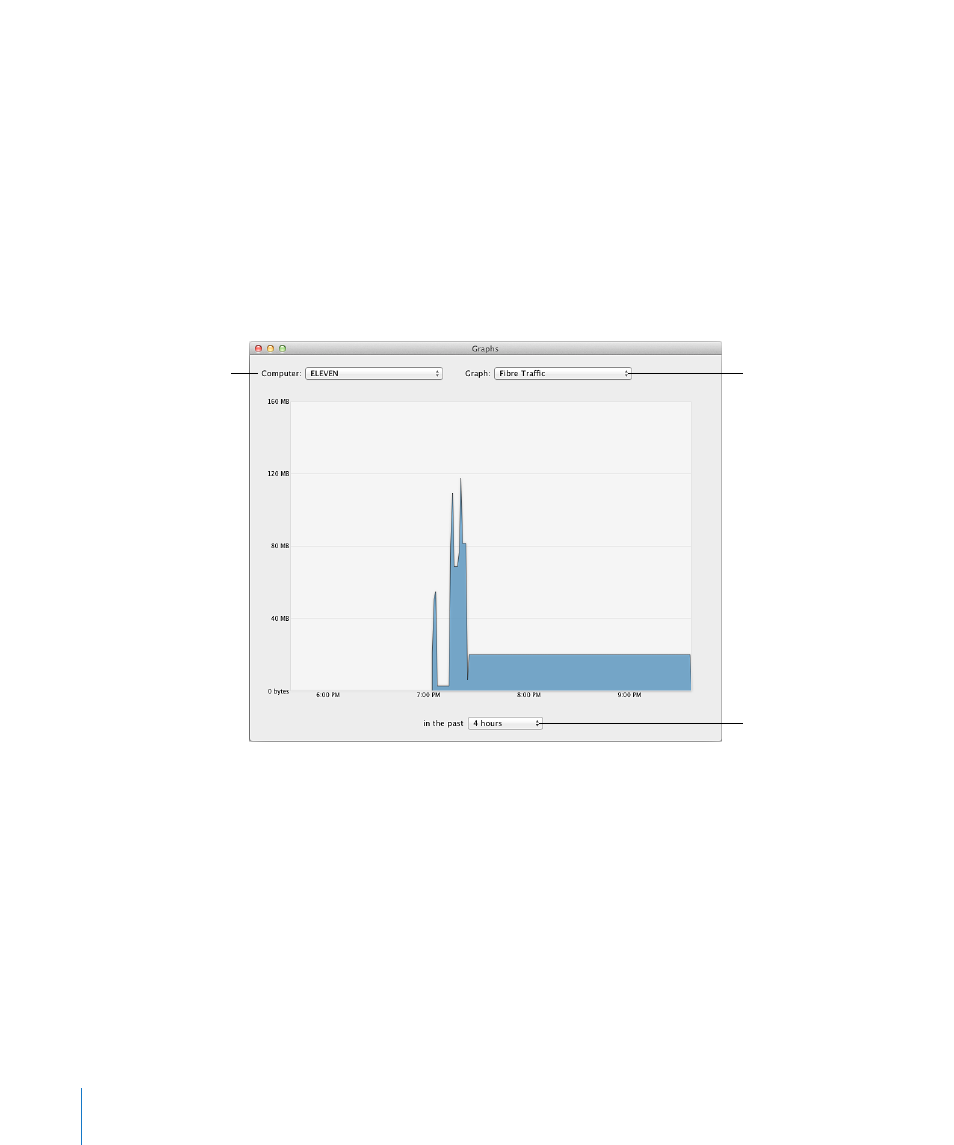
Graph SAN resource usage
Xsan Admin can display graphs of up to a week of CPU, memory, Ethernet, and Fibre
Channel usage data for any computer on the SAN.
Choose a SAN computer.
Choose a time period.
Choose a data type.
View usage graphs:
In Xsan Admin, click the Graphs button at the top of the window and use the three
m
pop-up menus in the Graphs window to choose a computer, a data type, and a
time interval.
Memory and CPU resources used by the file system process (fsm) for a volume are
listed under the name of the volume in the Graphs pop-up menu when you choose
the volume’s controller from the Computer pop-up menu.
From the command line
You can also check the file system process’s current CPU and memory usage by
using the
top
command-line tool in Terminal to check the process named
fsm
on the
volume’s controller. For information, see the
top
man page.
118
Chapter 8
Monitor SAN status