Graph mode, Viewing graphs – DAVIS Vantage Pro Console User Manual
Page 39

Graph Mode
Graph Mode
The Vantage Pro console includes a powerful Graph Mode that allows you to
view over 100 graphs of different kinds right on the screen. - all without con-
necting to a personal computer.
See Table “Vantage Pro Console Graphs” on page 36 for a list of the
available graphs.
Viewing Graphs
Although the graphs available may vary for each weather variable, you dis-
play the graphs in the same way:
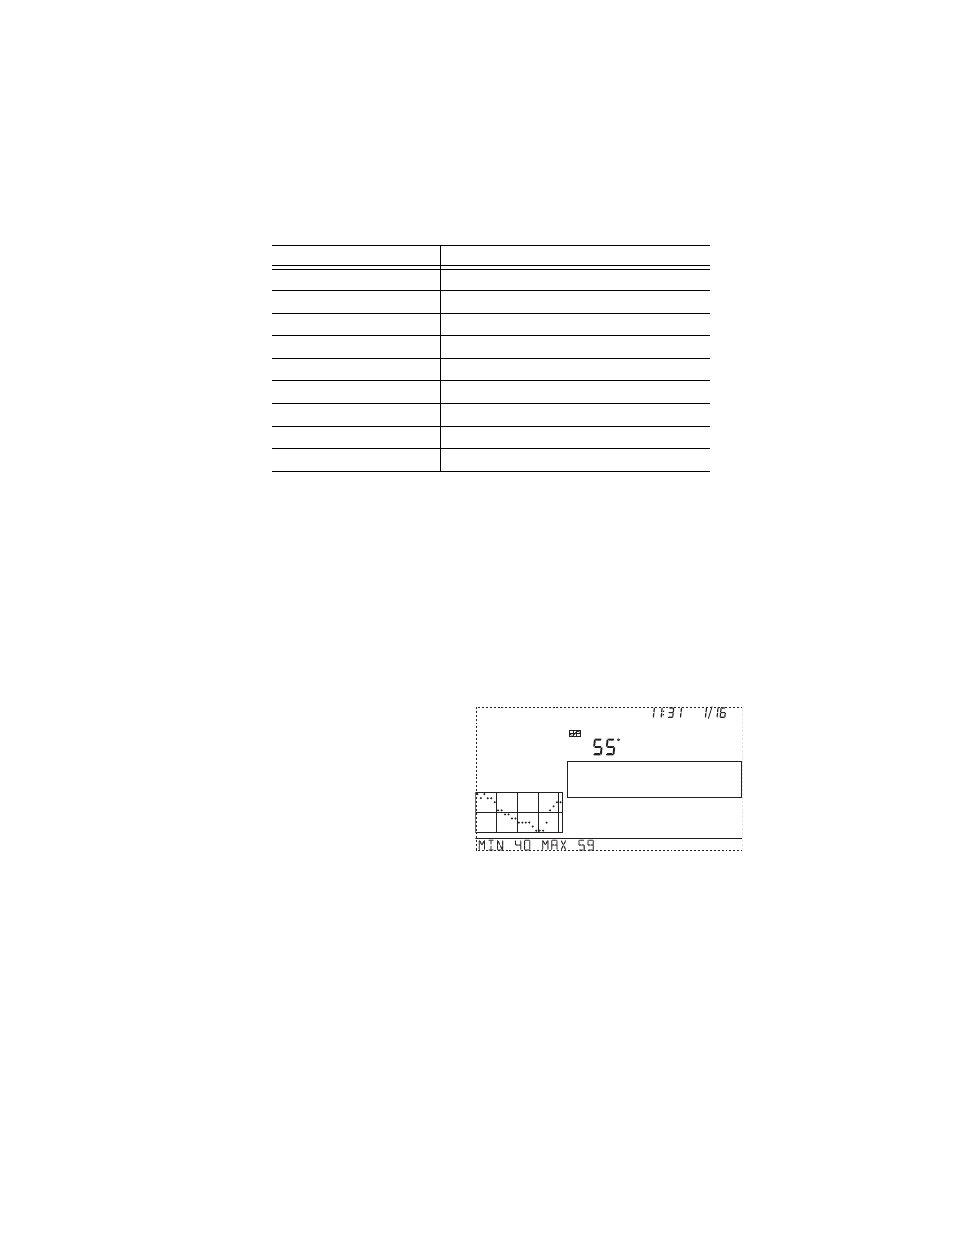
1. Press Graph to enter Graph
Mode.
Only the date, graph, graph
icon, and selected variable
are visible.
The rest of the screen will be
blank.
2. Select a variable to graph.
Values for the each of the last 24 hours are displayed in the graph, each
hour represented by a dot. The dot at right end of the graph is the value
for the current hour. You’ll notice that the dot is blinking.
3. Press the < key and the second dot from the right will start blink.
The screen displays the new dot’s value. The time display will show you
what hour of the last 24 you’re looking at.
4. Press the < and > keys to view the variable’s values for each of the last 24
hours. The console also display the maximum and minimum
temperatures recorded in the last 24 hours.
Outside Temperature
High and Low
Extra Temperature
High and Low
Heat Index Temperature
High
THSW Index Temperature
High
Wind Chill Temperature
Low
UV Radiation Index
High
UV Radiation MED
High -- uses the current total if variable has been reset
Wind Speed
High
Time & Date
Yes - the alarm sounds for 1 minute.
T
ABLE
3-3: V
ANTAGE
P
RO
S
TATION
A
LARMS
(C
ONTINUED
)
Variable
Alarms
GRAPH
Vertical Scale:
2
TEMP OUT
F
am
Last 24 hrs
hr
Every 1
