Watlow Addendum to EZwarePlus User Manual
Page 39
4) For Trend type choose Real-time.
5) For Distance between data samples/X axis time range choose Time.
6) In Distance type the number of seconds the width of the trend graph will represent. For
example, if you want to see two minutes of data at once, type 120.
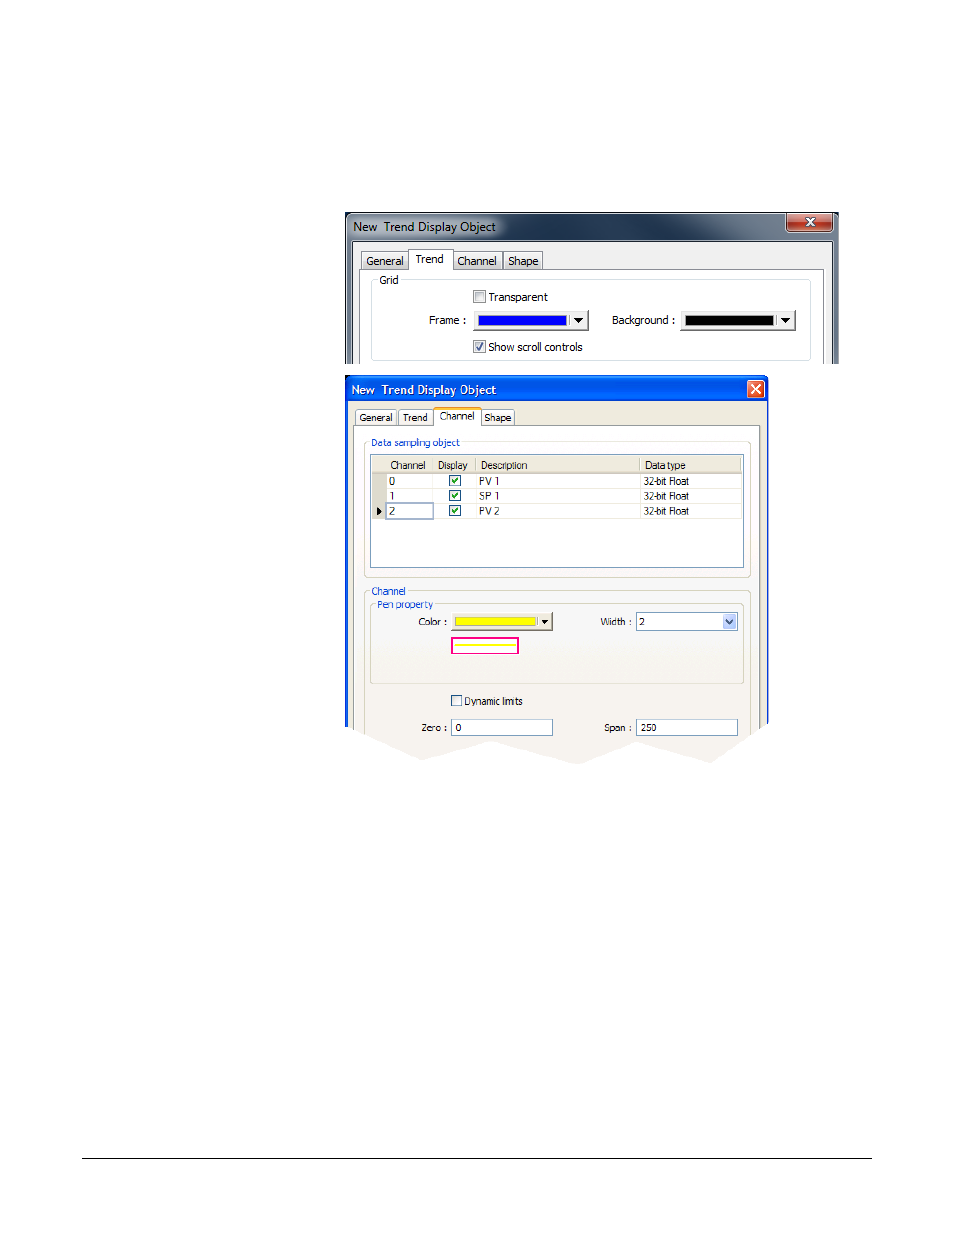
7) Click the Trend tab.
8) Choose a Frame color
and a Background
color.
(052)
9) Click the Channel tab.
10) For each channel to be
graphed:
• In the Data sampling
object group check
Display.
• For Color choose a
color that contrasts with
the background color.
• In Zero type the value
that should be graphed
at the bottom of the y-
axis.
• In Span type the value
that should be graphed
at the top of the y-axis.
11) Click OK.
(076)
Note: Keep in mind that while you can choose a different zero and
span for each pen, you don’t want to confuse users, so it may be best
to graph all the channels against the same zero an span values.
Silver Series EM OIT
39
Watlow Addendum
- 12LS Controller (111 pages)
- 8LS Controller (140 pages)
- 8PID Controller (55 pages)
- ANASCAN (62 pages)
- ANASOFT (95 pages)
- ANAWIN 2 (154 pages)
- ANAWIN 3 (23 pages)
- Calibrating Watlow Series 988 Family Process Controls (19 pages)
- CAS (98 pages)
- CAS200 (124 pages)
- CLS (180 pages)
- CLS200 (251 pages)
- CLS200, MLS300 and CAS200 (92 pages)
- Control Console (12 pages)
- CPC400 (230 pages)
- DIN-A-MITE Style A (9 pages)
- DIN-A-MITE Style B (14 pages)
- DIN-A-MITE Style C (22 pages)
- DIN-A-MITE Style D (9 pages)
- DIN-Mount Adapter Instruction Sheet, Rev A (1 page)
- Dual DAC (4 pages)
- EM Gateway (28 pages)
- E-Safe Hybrid Relay Rev B (4 pages)
- E-SAFE II Hybrid Power Switch (4 pages)
- EZwarePlus Programming (264 pages)
- EZ-ZONE PM (111 pages)
- EZ-ZONE PM PID (125 pages)
- EZ-ZONE PM Express Limit (34 pages)
- EZ-ZONE PM Express (35 pages)
- EZ-ZONE PM Integrated Controller (181 pages)
- EZ-ZONE RM Limit Module Rev C (127 pages)
- EZ-ZONE RMA Modul (79 pages)
- EZ-ZONE RMC (236 pages)
- EZ-ZONE RME (124 pages)
- EZ-ZONE RMH (161 pages)
- EZ-ZONE RUI/Gateway (62 pages)
- EZ-ZONE RM-Scanner-Modul (140 pages)
- EZ-ZONE ST (97 pages)
- F4 External Event Board - Rev.B (2 pages)
- HG Series Mercury Displacement Relay (6 pages)
- LogicPro (296 pages)
- Mercury Relay or MDR Retrofit (13 pages)
- MICRODIN (24 pages)
- MICRODIN (106 pages)