YSI Vertical Profiler Systems User Manual
Page 63

YSI Profiler System USER Manual
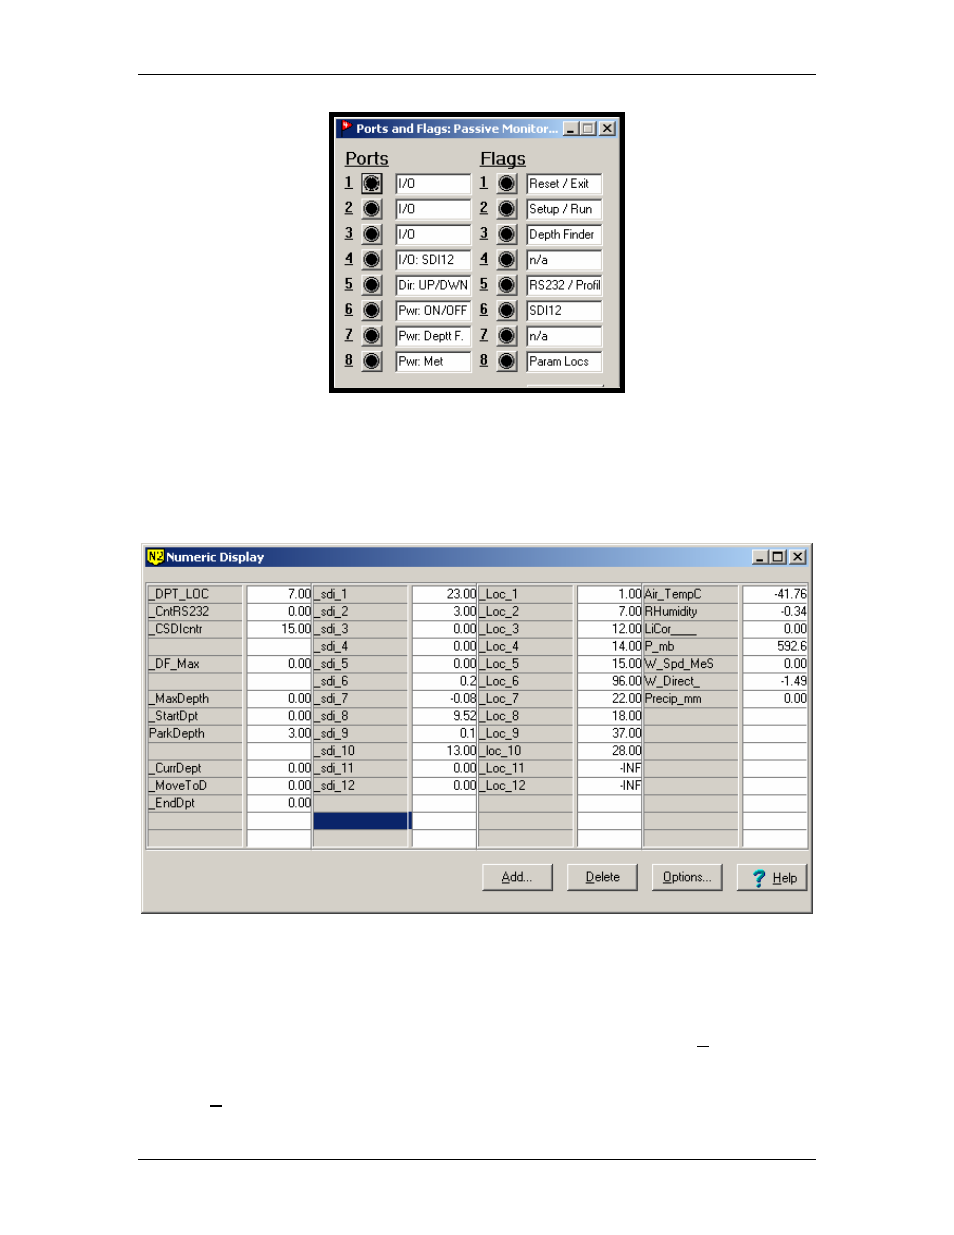
Within Data Displays, and just to the right of Numeric, click on the 1… button to open a blank
Numeric Display window. This window has three pairs of columns where you choose from a
pop-up list of memory locations that represent parameters or functions you would like to
monitor. The gray cells hold abbreviated descriptions, while the white cells exhibit values. An
example is shown below.
You will use the numeric display tables to assist in testing and/or troubleshooting the system.
Once you prompt actions, you can quickly visualize the profiler operation from the values in the
cells. When you first establish connection the values for each cell are typically blank, but fill in
once program execution begins, either by program or by prompting actions.
You build a Numeric table by highlighting a gray cell. When you click on the Add… button a
pop-up screen containing both Ports and Flags, and Memory locations will appear (see below).
Choose one of the options. Scroll and tag the location you want then ‘paste’ it into the cell(s) by
using the Paste button. You may tag several locations at once to paste them into a particular
YSI Environmental
669523 Rev B
Page 5-4
