Calculation of uncertainty, Sources of uncertainties, Uncertainty of spectral distribution – Ocean Optics RaySphere 1700 Install User Manual
Page 59: Uncertainty for spectral match test
9: Nonlinearity Correction, Stray Light Correction and Calibration
RAYSPHERE-1700-02-201304
49
Calculation of Uncertainty
Each wavelength calibration has an uncertainty which is reported in the wavelength calibration
documents for spectrometers from Ocean Optics. The resulting uncertainty is estimated from statistical
analysis and from typical intensity distribution of the light source.
Uncertainty for Spectral Match Test
It is difficult to extract the uncertainty for a spectral match test since no documents from national
metrology institutes or an international norm have defined how to perform this calculation for the special
case of a solar simulator.
Nevertheless, Ocean Optics provides a procedure to estimate the uncertainty of spectral match test.
Sources of Uncertainties
The following sources of uncertainty for the Spectral Match test were identified. They are explained in the
following sections.
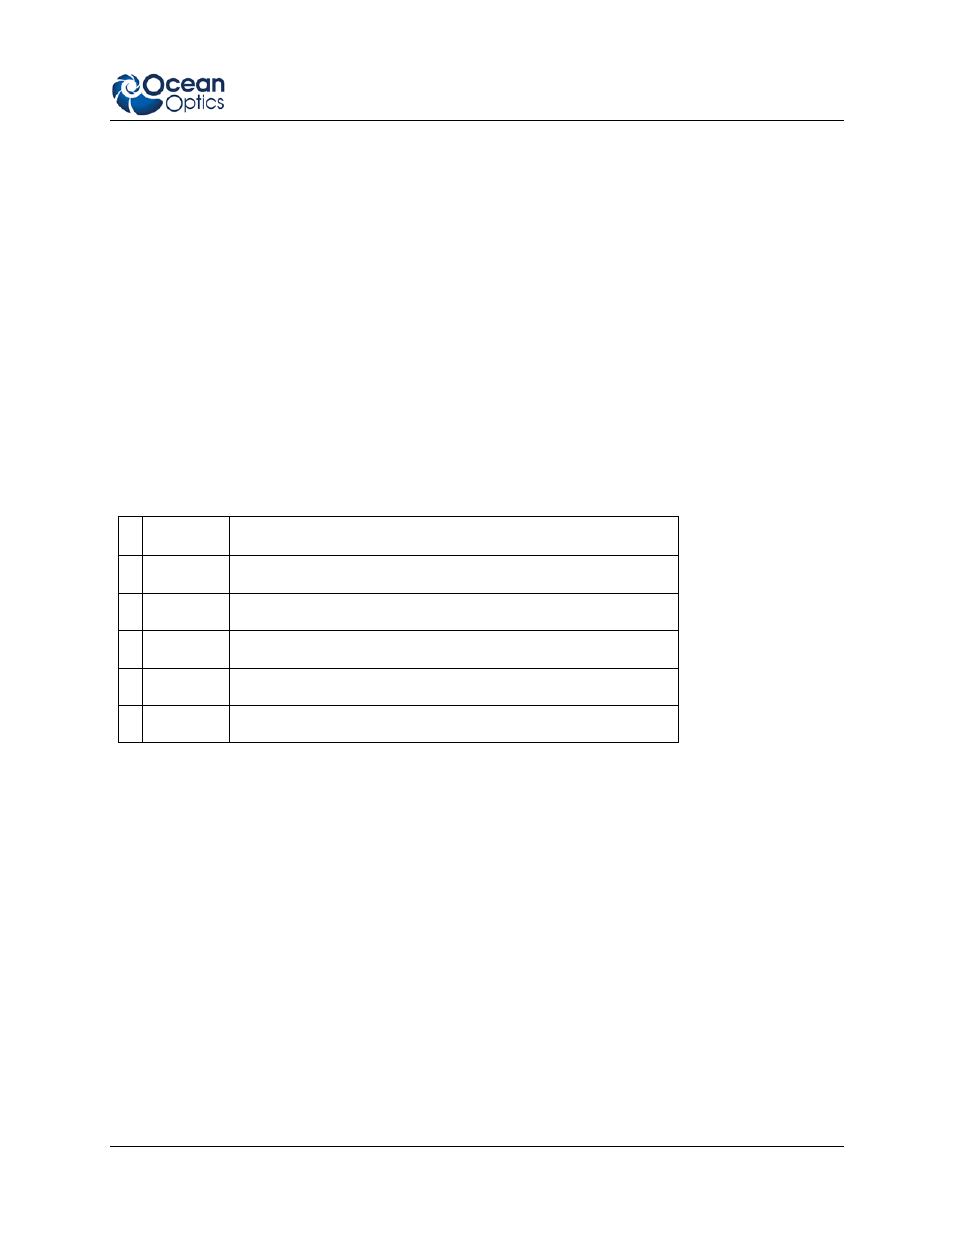
Quantity
Source of uncertainty
1. Spec_Distr Uncertainty of Spectral Distribution. Data from RaySphere Test.
2. Dark
Noise of dark-level [dark]
3. T_TEC
Influence of sensor temperature [T_TEC]
4. Rep
Repeatability when measuring a solar simulator.
5. StrayL
Influence of spectrometer’s internal stray light
Uncertainty of Spectral Distribution
The values for the uncertainty of spectral distribution are extracted from the data from the test of
calibration at the independent optical test lab at Heraeus Noblelight.
Each RaySphere system is tested with a 1000 W FEL light source calibrated by German PTB. The
optical output is well defined. The uncertainties for absolute irradiance for k = 2given by the PTB
(Kalibrierzeichen: 40096-10-PTB) are between 1.1 % at 400 nm and 1.3 % at 1100 nm. The spectrum of
the calibration lamp is shown in the following graphs. The blue curve represents the output power of the
used calibration lamp at Heraeus Noblelight in absolute irradiance.
In an ideal case no difference between output power from the calibration lamp and measured spectrum
from Raysphere is present. Nevertheless, deviations are present and can be verified. Typical data for data
from 400 nm to 1050 nm and 900 nm to 1700 nm are shown in the graphs. The red curve represents
deviation and belongs to the right axis.
Note:
The zero value for deviation is not at the wavelength axis.