Spectrum graph, Spectrum dialog box – Ocean Optics RaySphere 1700 Install User Manual
Page 26
3: Software Operation
16
RAYSPHERE-1700-02-201304
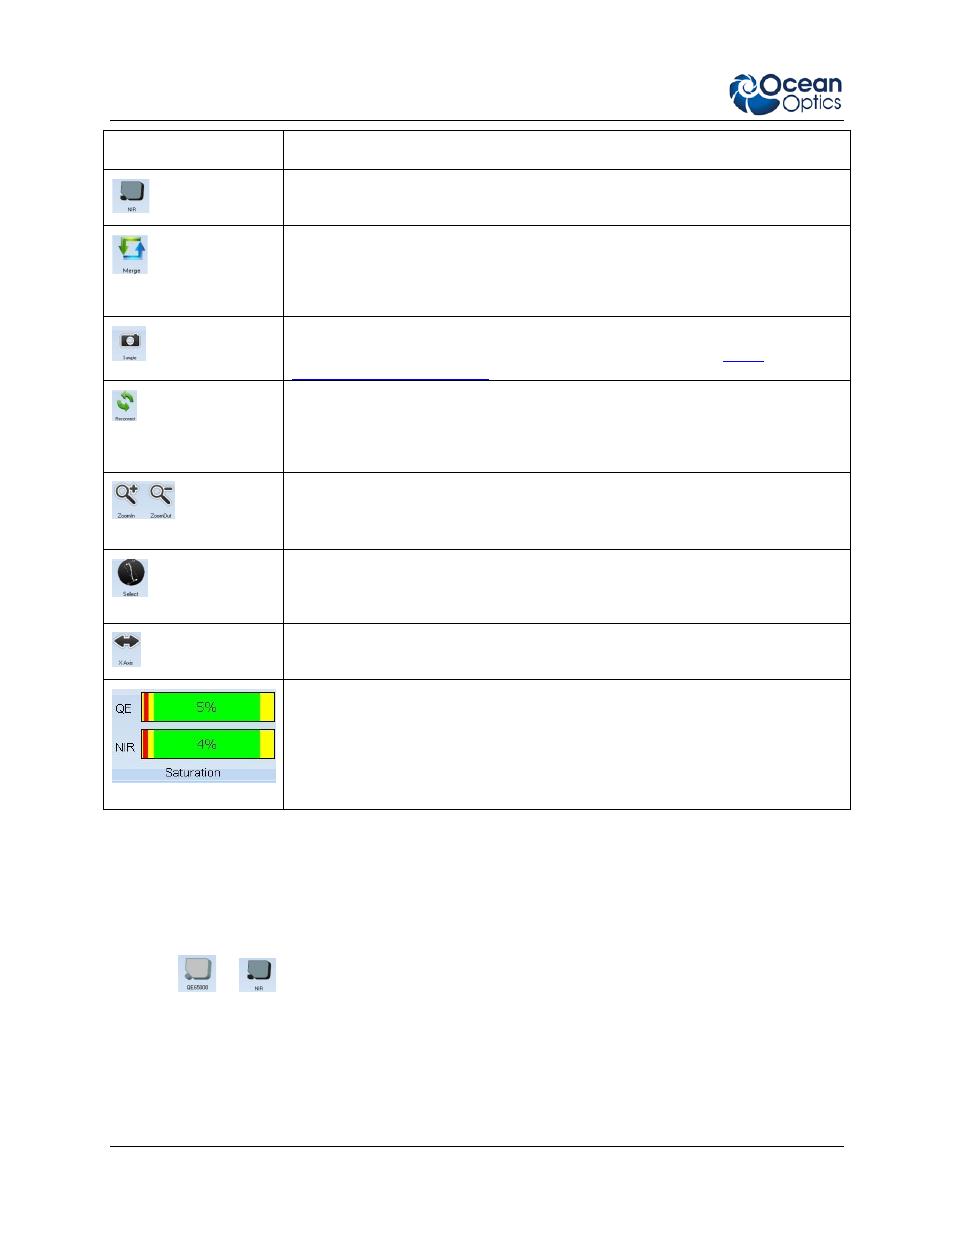
Control
Function
NIR
Displays the Spectrum dialog box for changing the NIRQuest512 settings (if the
NIRQuest512 is installed in your RaySphere).
Merge
Merges the spectral data from the QE65000 and NIRQuest512 spectrometers
(if your RaySphere contains both spectrometers). There is an overlap in the
spectral range from 950 nm to 1050 nm if both spectrometers are built into your
RaySphere. The merge interval is limited to 1 nm in width.
Sample
Records a spectrum the manual trigger mode is active. The exact function of
Sample depends on the selected Trigger Source setting in the
Reconnect
When this button is pressed, the software tries to connect to the
spectrometer(s). If the spectrometer(s) are not connected after pressing the
button several times, restart the program and reapply power the RaySphere
system.
Zoom
In/Zoom Out
Changes the scaling in the graph with the absolute irradiance displayed.
Select
Use this button in conjunction with the mouse to select and zoom in on a
specific area of the graph. The Select function does not affect the x-axis
scaling.
x-Axis
Changes the wavelength range on the graph’s x-axis.
Saturation
Indicates the spectrometer saturation.
Spectrum Graph
The Graph displays the last recorded spectrum. The absolute irradiance data is represented by the y-axis
in µW/cm^2/nm while the x-axis shows the wavelength in nm.
Spectrum Dialog Box
Press the
or
buttons to invoke the Spectrum dialog box.