Laser beta lasermike LS8000-3 User Manual
Page 114
LaserSpeed 8000-3 Instruction Handbook
LaserTrak Software
Part No. 93463 / Drawing No. 0921-01561
Page 114 of 221
Revision A (Sep 2007)
Middle line of Chart Recorder Screen- shows the program control line
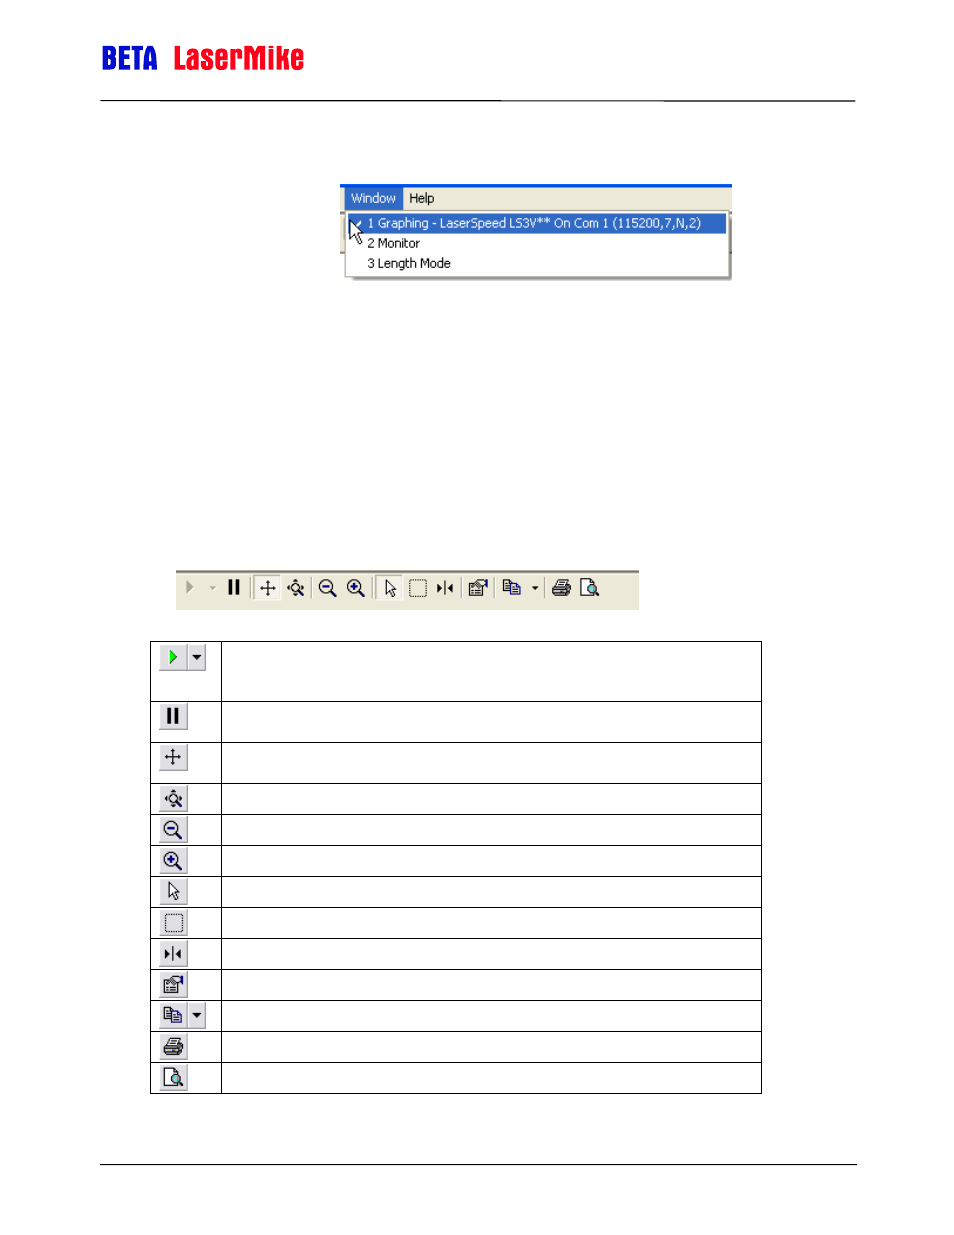
Window – Once the
Graphing, Monitor
and Length windows
have been opened,
Window allows
switching between
each window.
Help- Brings up the about LaserTrak screen. The About screen shows the
Date, part number, and software version number of the software.
Chart Recorder Toolbar
The Chart Recorder graphs the velocity and quality factor data acquired from
the LaserSpeed gauge. The Tool bar functions allow the user to configure the
graph for each application.
Resumes tracking or makes the graph active again. If the arrow is greyed
out the graph will not scroll. Click on the arrow to make the graph active.
The arrow will turn green the active scrolling is enable.
Freezes the graph but the software continues to acquire data, use resume
to make graph active again.
Axis scroll control. Allows the cursor to grab the axis increase or decrease
the scale.
Axis Zoom control, allows the cursor to grab the axis and zoom in or out.
Zooms Out
Zooms In
Selects Objects
Zoom Box, draws a box around data that will be zoomed in on
Data Cursors
Edit graph parameters, password protected and greyed out when not active
Copies an image of the graph, or the raw data to the clipboard.
Prints graph image
Print Preview