Horizontal controls (frequency axis), Vertical controls (amplitude axis), Spectrogram controls – MOTU 828x 28x30 Audio Interface with ThunderTechnology User Manual
Page 97
C U E M I X F X
97
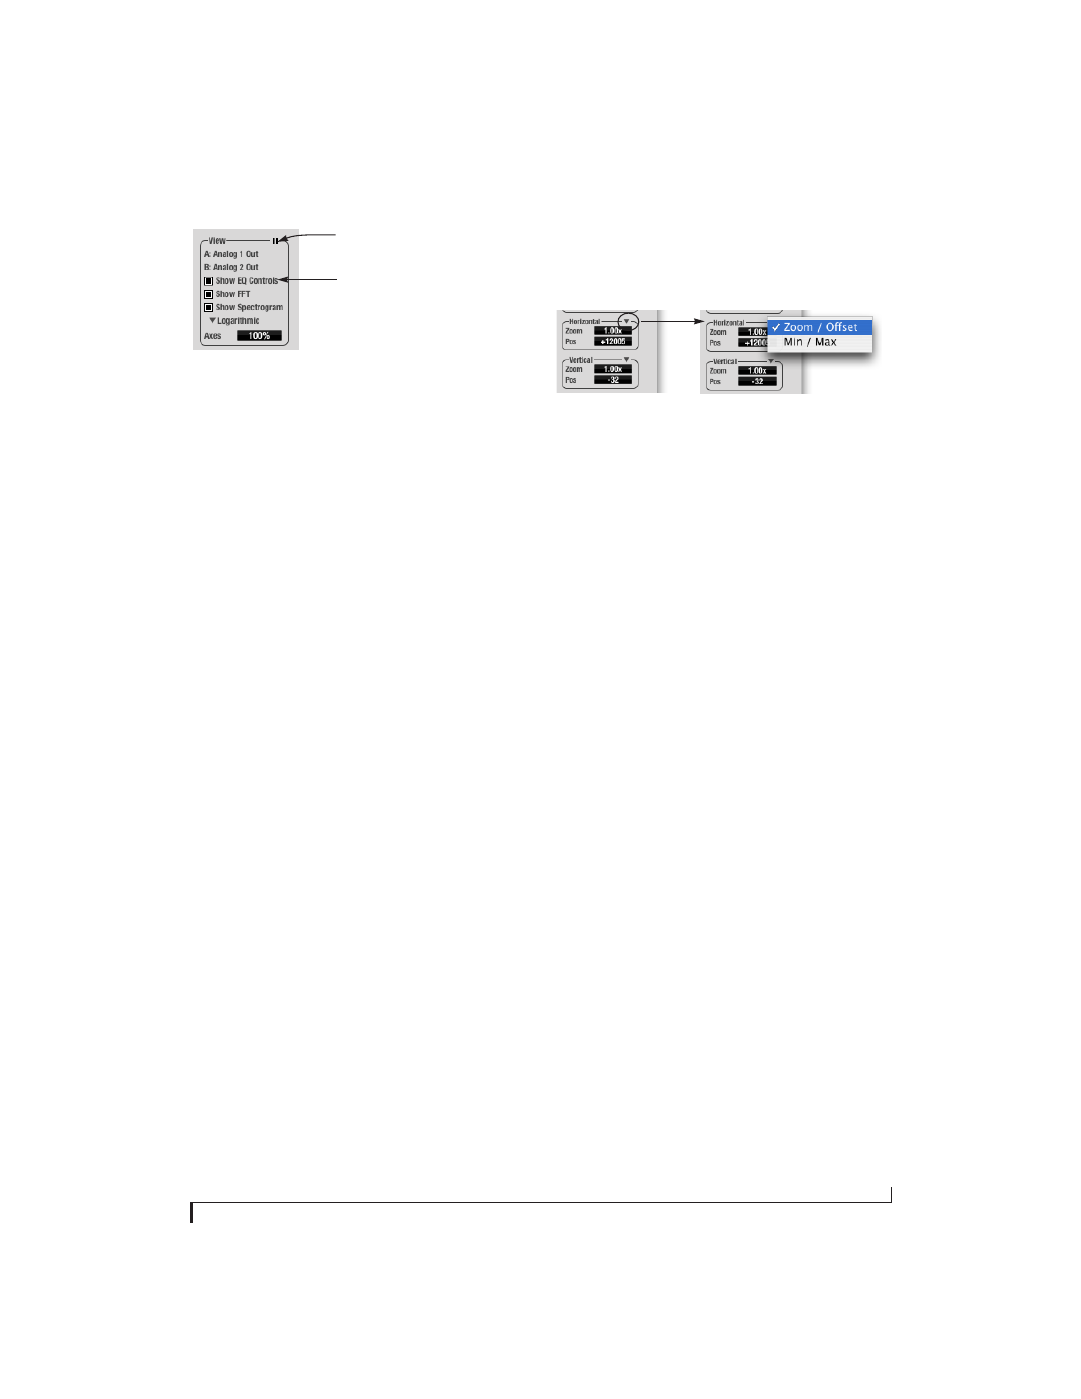
Figure 9-33: View controls
These settings are independent of the small graph
display options (Figure 9-10 on page 80), so you
have the flexibility to display different
combinations in each graph.
☛
“Show EQ Controls” will be available only if
the focused pair is a stereo input pair or stereo
output pair.
Logarithmic or Linear X-Axis Scale
The x-axis defaults to a logarithmic scale, but can
be changed to a linear scale if desired. In the View
controls (Figure 9-33), click
Logarithmic
to access
the x-axis scale options menu. With a linear scale
selected, frequency is constant, but the width of
each octave along the x-axis is different. With a
logarithmic scale selected, octaves are displayed
with a constant width, but frequency is displayed
logarithmically within each octave.
Axes display
The
Axes
control (Figure 9-33) sets the opacity of
the grid displayed in the graph, from 100% (fully
visible) down to 0% (fully hidden).
Pausing the display
The Pause button in the upper right corner of the
View section (Figure 9-33) allows you to freeze the
display at any time. To resume, click the button
again.
Horizontal controls (frequency axis)
The
Horizontal
controls (Figure 9-34) configure
the value range of the x-axis (frequency). Click and
drag the values up or down to set them, or double-
click to return to the default value.
There are two modes for the controls:
Zoom/Offset
and
Min/Max
. To change the mode, use the
Horizontal control menu (Figure 9-34).
Figure 9-34: Horizontal control menu
In
Zoom/Offset
mode,
Zoom
sets the display zoom
from 1x to 100x, where the number represents the
zoom factor relative to the entire frequency range.
For example, when the horizontal zoom value is 1x,
the entire frequency range from 10 to 24000 Hertz
is displayed; when the horizontal zoom value is 2x,
one half of the entire frequency range is displayed.
Pos
determines which frequency is displayed at the
center of the graph.
In
Min/Max
mode,
Min
and
Max
set the lowest and
highest displayed frequencies (in Hertz).
Vertical controls (amplitude axis)
The
Vertical
controls (Figure 9-29) operate
similarly to the Horizontal controls, except that
they configure the y-axis (amplitude).
In
Zoom/Offset
mode,
Zoom
sets the display zoom
from 1x to 100x, and
Pos
sets the center amplitude
of the graph. In
Min/Max
mode,
Min
and
Max
set
the smallest and largest displayed amplitude.
Spectrogram controls
The
Floor
control (Figure 9-29) sets the amplitude
threshold for the spectrogram display, from -144
dB up to 0 dB.
The
Alpha
control (Figure 9-29) sets the opacity of
the spectrogram information displayed in the
graph, from 100% (fully visible) to 0% (hidden).
Pause button
Display options