8theoretical background – Multichannel Systems Cardio2D Manual User Manual
Page 115
111
8
Theoretical Background
8.1
Cardiac Action Potential
Over the last 30 years, non-invasive extracellular recording has developed into a widely used
standard method.
The semi-permeable lipid bilayer cell membrane separates different ion concentrations (charges)
on the inner and outer side of the membrane. Conventional methods measure the membrane
potential that results from the electrochemical gradient directly with an intracellular electrode.
When ion channels are opened due to chemical or electrical stimulation, the corresponding ions
are moving along their electrochemical gradient. In other words, the resistance of the membrane
is lowered, resulting in an inward or outward flow of ions, measured as a transmembrane current.
The extracellular space is conductive as well, and though the resistance is very low, it is not zero.
According to Ohm's law (U=R*I), the extracellular current results in a small voltage that can be
measured with extracellular electrodes. Extracellular signals are smaller than transmembrane
potentials, depending on the distance of the signal source to the electrode. Extracellular signal
amplitudes decrease with increasing distance of the signal source to the electrode. Therefore,
a close interface between electrode and cell membrane is very important for a high signal-to-
noise ratio.
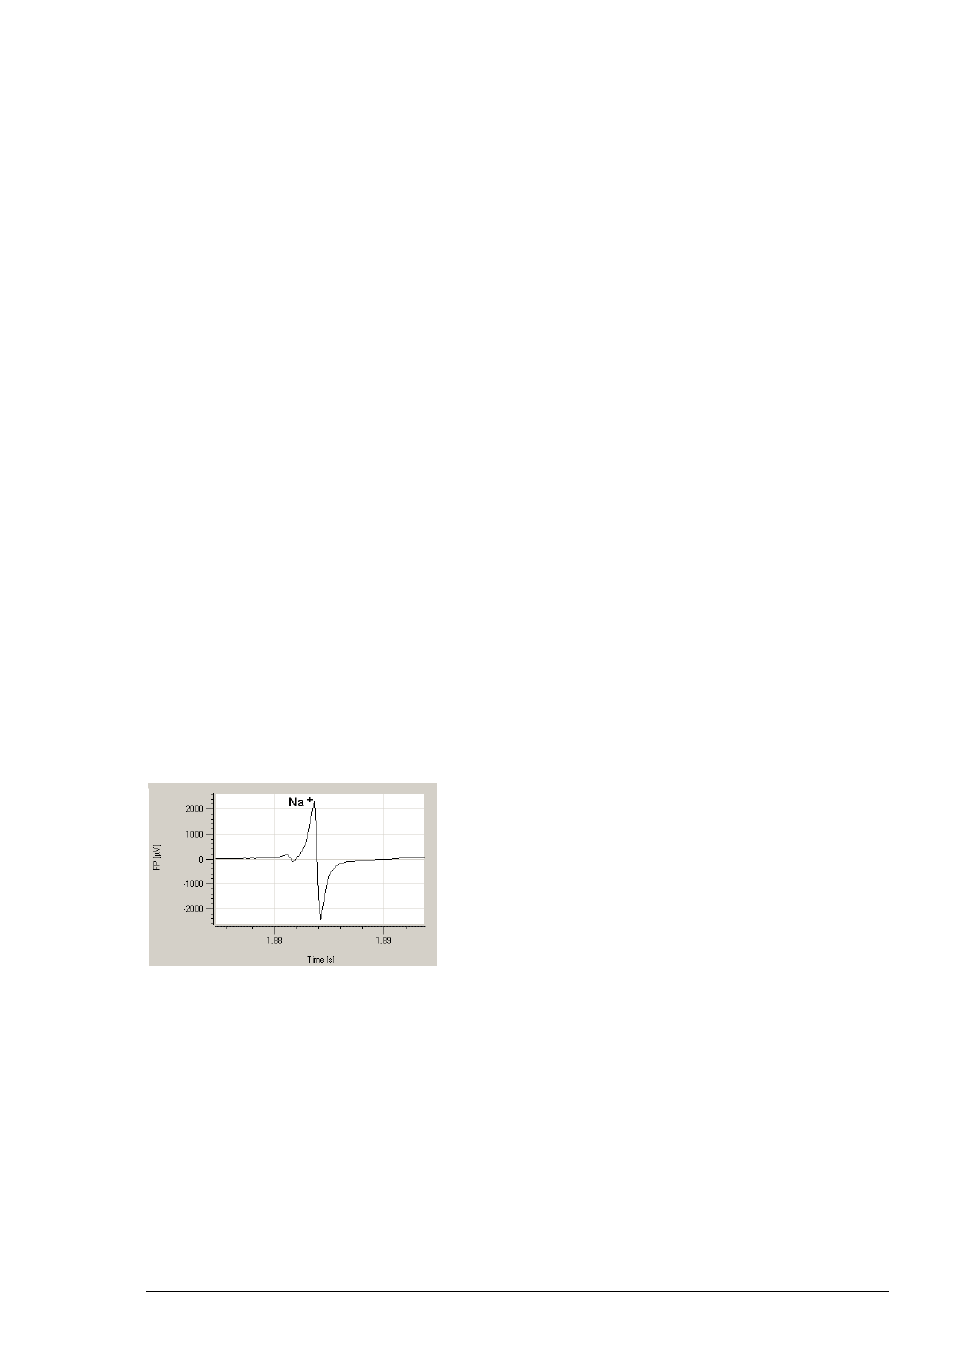
The transmembrane current and the extracellular field potential follow the same time
course. The field potential is roughly equal to the first negative derivative of the transmembrane
potential, thus revealing an information that is comparable to conventional methods. This has
been shown for different types of signals derived from neuronal preparations as well as cardiac
preparations. This convenient method is used by Cardio2D. Simultaneous recordings of action
potentials (with intracellular electrodes) and field potentials (with extracellular electrodes) have
shown that there is a linear relationship between the rise time of the cardiac action potential
(AP) and field potential (FP) as well as between AP and FP duration. The contribution of
different ionic transmembrane currents can be identified in the shape of the FP waveform as well,
as shown in the following picture. The correlation between the waveform components and the
ion channel activities was shown by using ion channel blockers or depleting the medium of the
respective ions. You can clearly see the rapid component of the depolarizing sodium current and
the slow calcium current.
The delayed rectifying K+ current (IKr) is represented either by a positive or negative peak.
The polarity of the peak depends on several parameters, for example, the proximity of the cell
layer to the measuring electrode, and cannot be predicted, which does not matter for this assay.
The field potential duration corresponds to the action potential duration, which can be correlated
to a QT-like Interval in an electrocardiogram. It is measured from minimum of the Na+ peak
to the maximum / minimum of the IKr current peak.