Multichannel Systems Cardio2D Manual User Manual
Page 112
Cardio2D Manual
108
Dose Response Curve
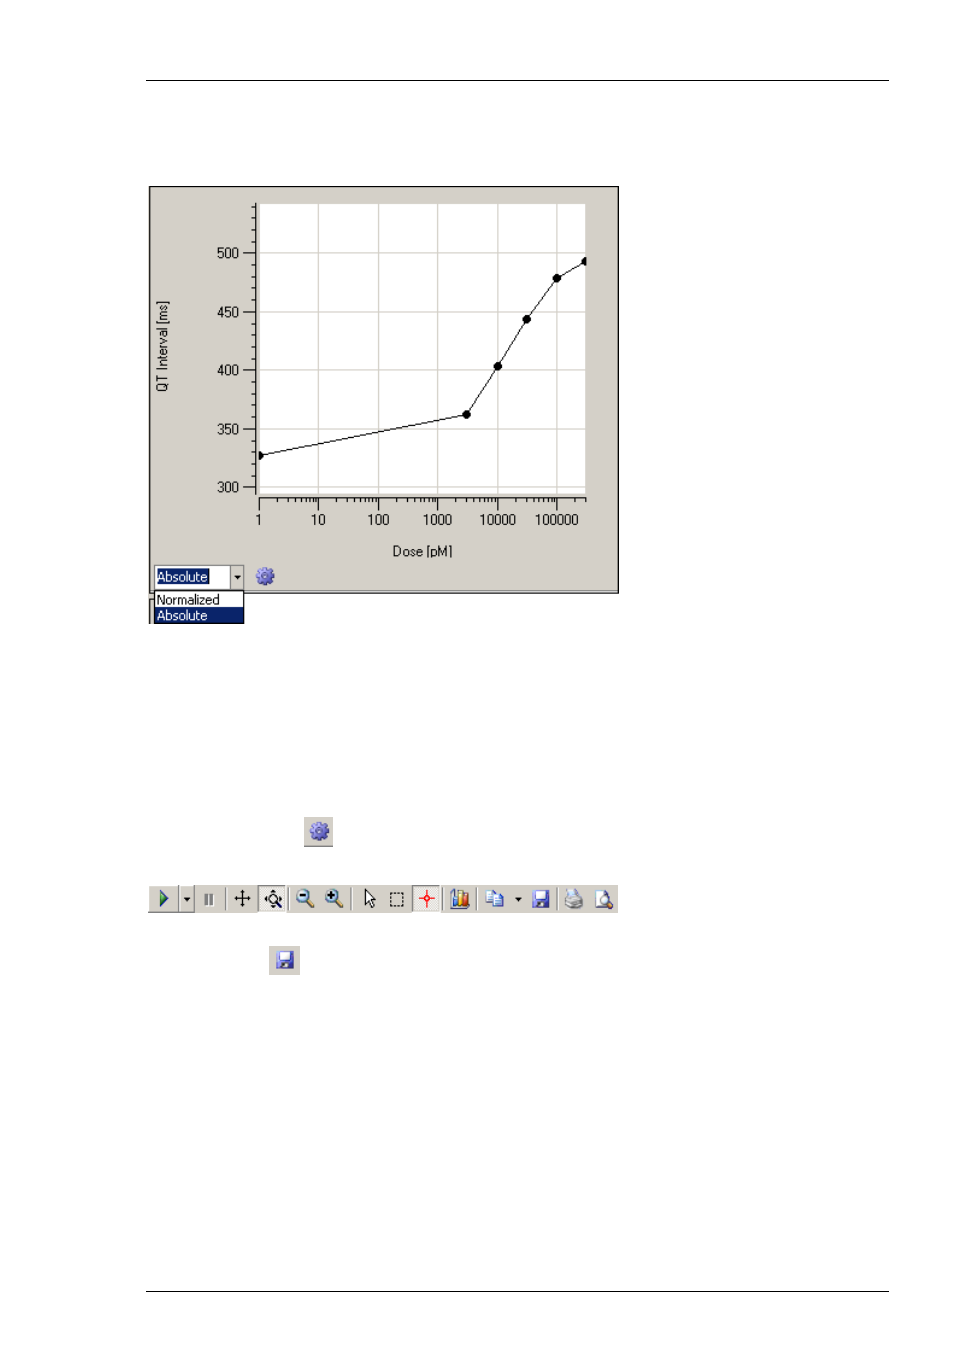
The right side shows a diagram of the dose response curve, if the recorded data allow
to calculate it.
The curve is available in "Normalized" or in "Absolute" form, the x-axis is logarithmic.
In "Normalized" plots the reference is not integrated in the plot. In "Absolute" plots of the dose
response curve the standard reference of 0 μM is set to 1 μM and displayed in the logarithmic
scale.
Data Export to ASCII
Click the "Plot" icon
. The following toolbar appears. Please read also chapter
"General Software Features".
The data displayed in the different windows can be exported to ASCII format by clicking
the icon "Save"
.