Multichannel Systems Cardio2D Manual User Manual
Page 101
Cardio 2D+ Analyzer Software
97
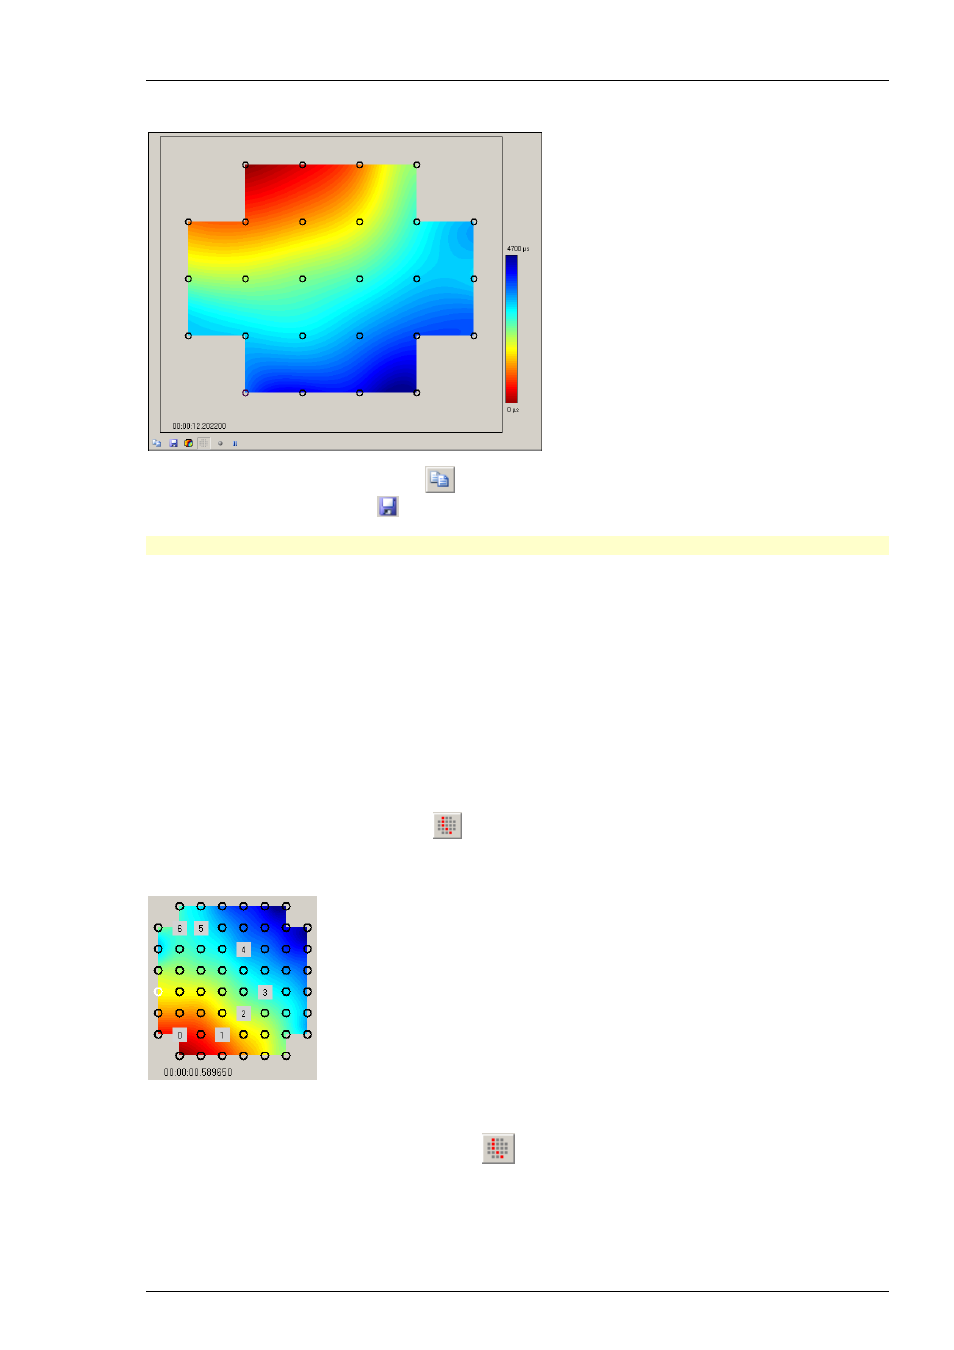
Color Map
Click the "Copy to Clipboard" icon
to copy the color map to the clipboard.
Click the "Save Picture" icon
to save the color map as a picture in *.png format.
Note: Stopping the real-time monitoring saves computer performance!
The color map displays the spreading of the excitation of a heartbeat from the pacemaker to the
outer regions of the cell culture or tissue. If the pacemaker is not on the MEA, the earliest point of
detection is used instead of the pacemaker. The isochrones are indicated by black lines. The colors
indicate the time distance between the first signal and the outer regions of excitations.
The action potential runs over the heart cell culture or tissue or hole heart from the pacemaker to
the outer regions. The MEA electrodes mirror this excitation. The propagation time is the longest
possible period for passing of the excitation from the first excited electrode to the last excited
electrode of one cluster. Define the propagation time in the "2D" tab of the "Analyze" dialog.
Please see below. If the propagation time is too short, you miss data for the complete heartbeat.
If the propagation time is too long, the next heartbeat starts and the results are incorrect.
So, the appropriate time has to be tested empirical, depending on the experiment.
Click the "Set Propagation Path" icon
iin the color map window. After selecting the option
in the color map you can define a propagation path manually by clicking on the electrodes of
the color map. For deselecting electrodes of the path, please click the electrode again.
The setting for the "Propagation Path" is from minimum to maximum by default. If you like to
define a propagation path manually, for example, when propagation is not linear but circular,
please click the icon "Set Propagation Path"
in the color map. After selecting the option
in the color map you can define a propagation path manually by clicking on the electrodes of
the color map. For deselecting electrodes of the path, please click the electrode again.