Multichannel Systems Cardio2D Manual User Manual
Page 100
Cardio2D Manual
96
Single channel view and the color map of the "Heartbeat" tab correspond with each other: The
excitation pattern of that heartbeat marked with a blue arrow is exactly shown in the color map.
Selecting a new heartbeat with the blue arrow, the color map will be adapted immediately. The
user has four possibilities to analyse the heartbeats: Click near to any heartbeat, and it will be
marked with the blue arrow. This way you can jump to any heartbeat of that recording phase.
Or you can analyze each single heartbeat and the related color map step by step by clicking the
icons "Previous"
and "Next"
. Or you can run through all heartbeats automatically with
"Play"
and stop the performance with "Stop"
. Or you can click onto a data point in the
plot of the "Latency / Velocity" window.
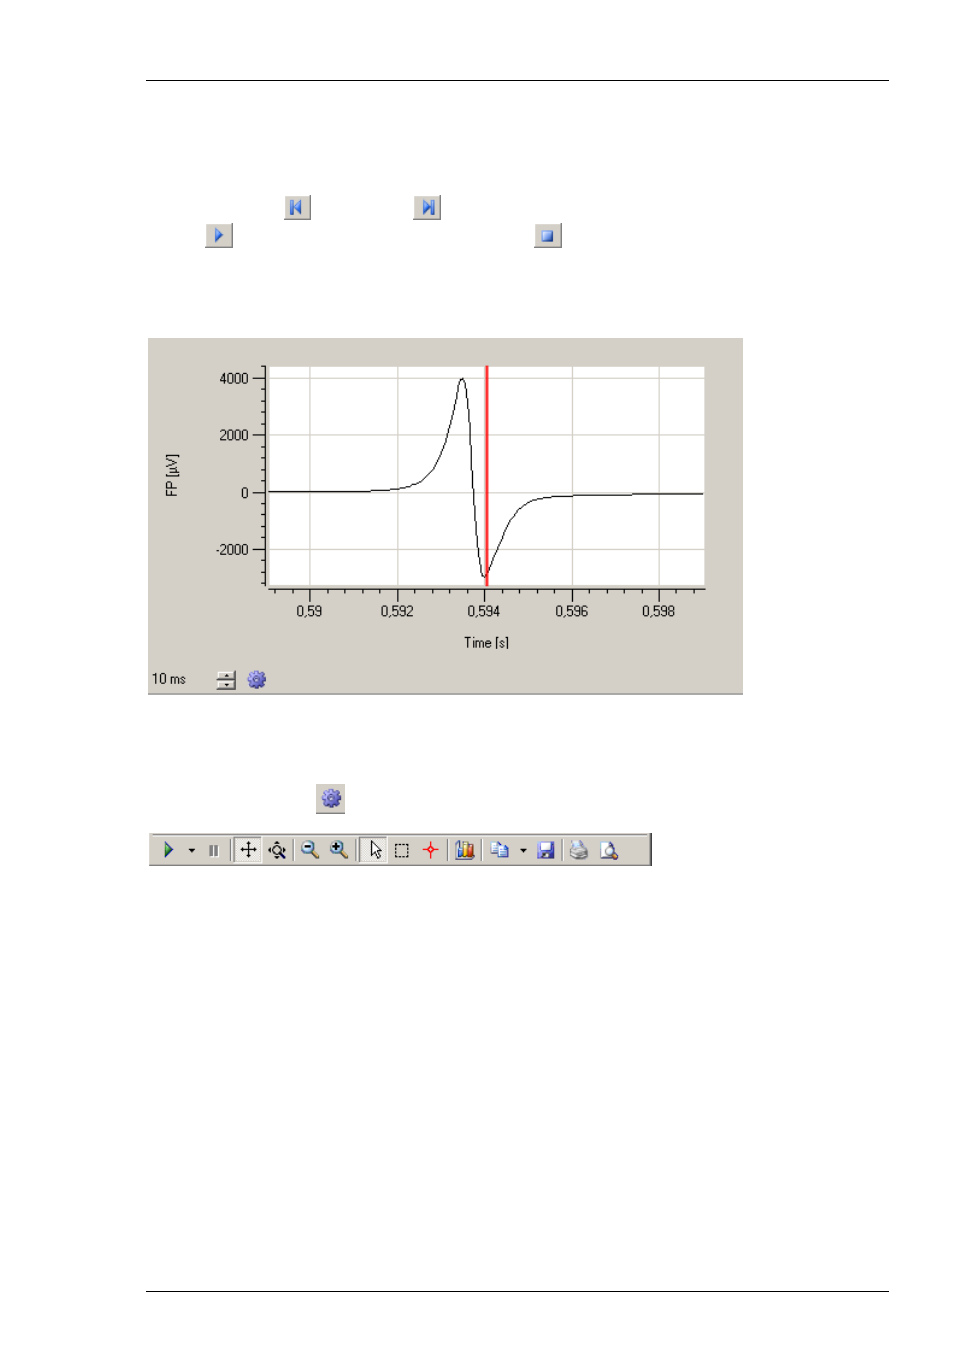
MEA Electrode
In the MEA electrode window the field potential of exactly that electrode is displayed which
is selected in the color map via mouse. To adjust the size of the displayed raw data interval,
please use the up down control box.
Click "Edit Plot" icon
. A plot menu appears.
With the help of the plot menu it is possible to modify a lot of plot parameters. For example, you
can adapt the figure to a special layout wanted for a special publication. Please see also chapter
"General Software Features".