Intuition xg control panel and xg dashboard, Intuition xg control panel and xg dashboard -3 – Grass Valley Intuition XG v.5.0 User Manual
Page 36
Intuition XG Configuration Guide
3-3
Intuition XG’s Desktop Applications & Tools
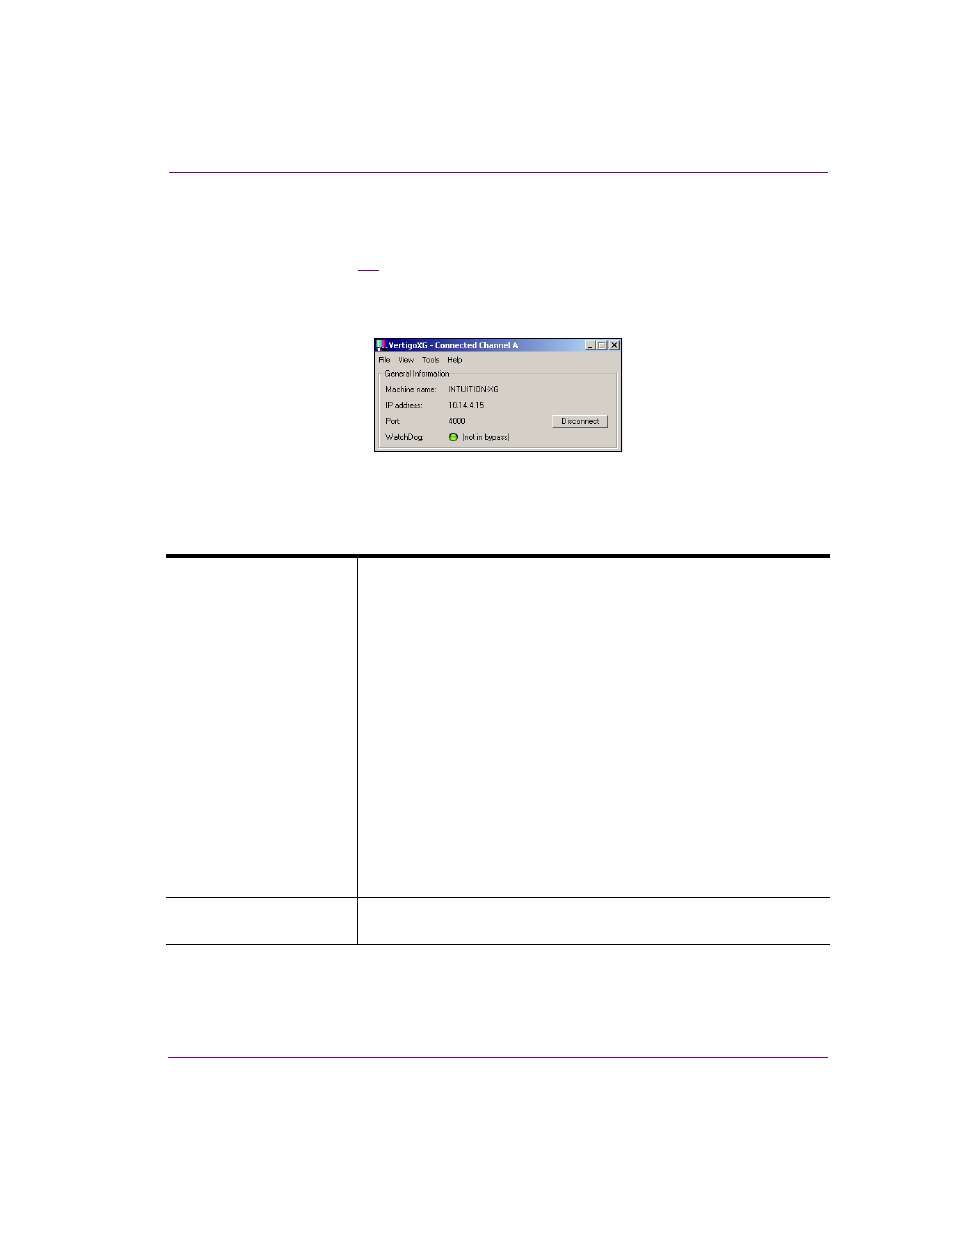
Intuition XG Control Panel and XG Dashboard
When the Intuition XG is started, the Intuition XG Control Panel is automatically opened
on the desktop (figure
). The Control Panel is a simple user interface that allows you to
quickly reference general information about the Intuition XG device, as well as perform
basic tasks for operating the Intuition XG like, loading a scene and launching the
XG Dashboard application.
Figure 3-2. The Intuition XG’s Control Panel
The following tables provides descriptions of the commands and fields on the Intuition XG’s
Control Panel:
G
ENERAL
I
NFORMATION
These read-only fields display information regarding the local host
computer that is being used to run/control the Intuition XG device.
•
M
ACHINE
N
AME
: Name of the host computer.
•
IP A
DDRESS
: The IP address of the host computer.
•
P
ORT
: The port number that is dedicated to the Intuition XG.
•
W
ATCH
D
OG
: The Watchdog field on the Intuition XG’s Control Panel
displays a colored LED along with a brief description indicating its
status.
The possible states for the Intuition XG’s Watchdog are:
• G
REEN
- not in bypass
• Y
ELLOW
– bypass is active – nothing to render
• Y
ELLOW
– bypass is active – user triggered
• R
ED
– bypass is active – other channel failed
• R
ED
– bypass is active – D3D error
• R
ED
– bypass is active – error
• G
REY
– Disabled
• G
REY
– Ignored
D
ISCONNECT
button
Promptly closes the connection between the Intuition XG device and the
application that it was actively connected to.