B&C Technologies DI-325 Industrial User Manual
Page 79
OPERATING AND PROGRAMMING INSTRUCTIONS
8-48
11.1 Dashboard (Management Information System)
A full user manual for this software is available separately. Here we give an overview of the
main functionality provided by the software.
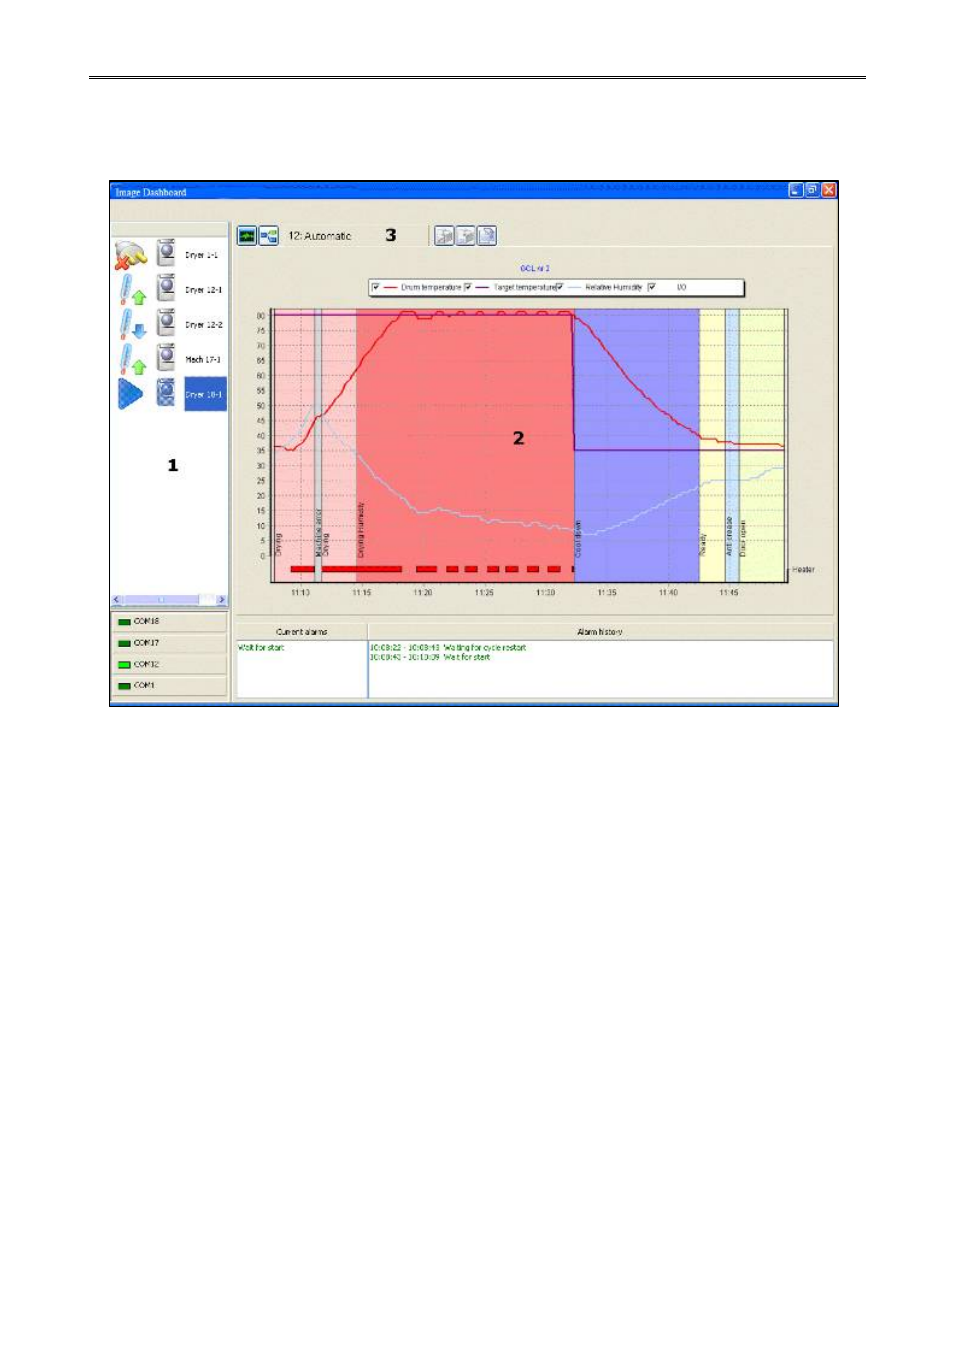
1 – Machines list
This section of the main screen gives an overview of the machines which have been
connected to the PC and entered into the programme configuration. For each machine it shows the
assigned name, and icons indicate the status of the machine (disconnected, heating, cooling, ready
etc). Select any of the machines in the list and the relevant data from that machine will be shown in
the graph area (2). Selecting a machine with the right mouse button gives access to the settings
menu (4 below) where the parameters of the machine can be modified.
A list of all configured com ports is given below the overview list of machines, and “lights”
indicate the presence of network activity for each port.
2 – Operational data graph
The graph shown in this part of the main screen is a representation of the activity of the
machine which has been selected in the machines list. It shows the trends for the current cycle of
temperature, humidity etc in addition to heater activity (red blocks along the bottom edge), and the
phases through which the cycle has progressed. In the case shown these are drying, drying on
humidity sensor (optional module for the DQ 01), cooling down, ready, anti-crease (drum rotates to
prevent load becoming creased) and door open (load removed).
Below the graph a list of current alarms is given, alongside an alarm history.