Status bar – Bio-Rad Image Lab™ Software User Manual
Page 61
Interface Overview
User Guide
| 61
MW Analysis Tools (Molecular Weight Analysis) enables you to choose standard
samples, assign standard lanes, and choose a regression method.
Quantity Tools enables you to automatically quantify bands, using either relative or
absolute values.
Annotation Tools
enables you to add formatted text and arrows to any area of a
gel.
Volume Tools enables you to manually quantify an object inside a boundary that
you define.
These tools are described in
Analysis Tool Box Tools on page
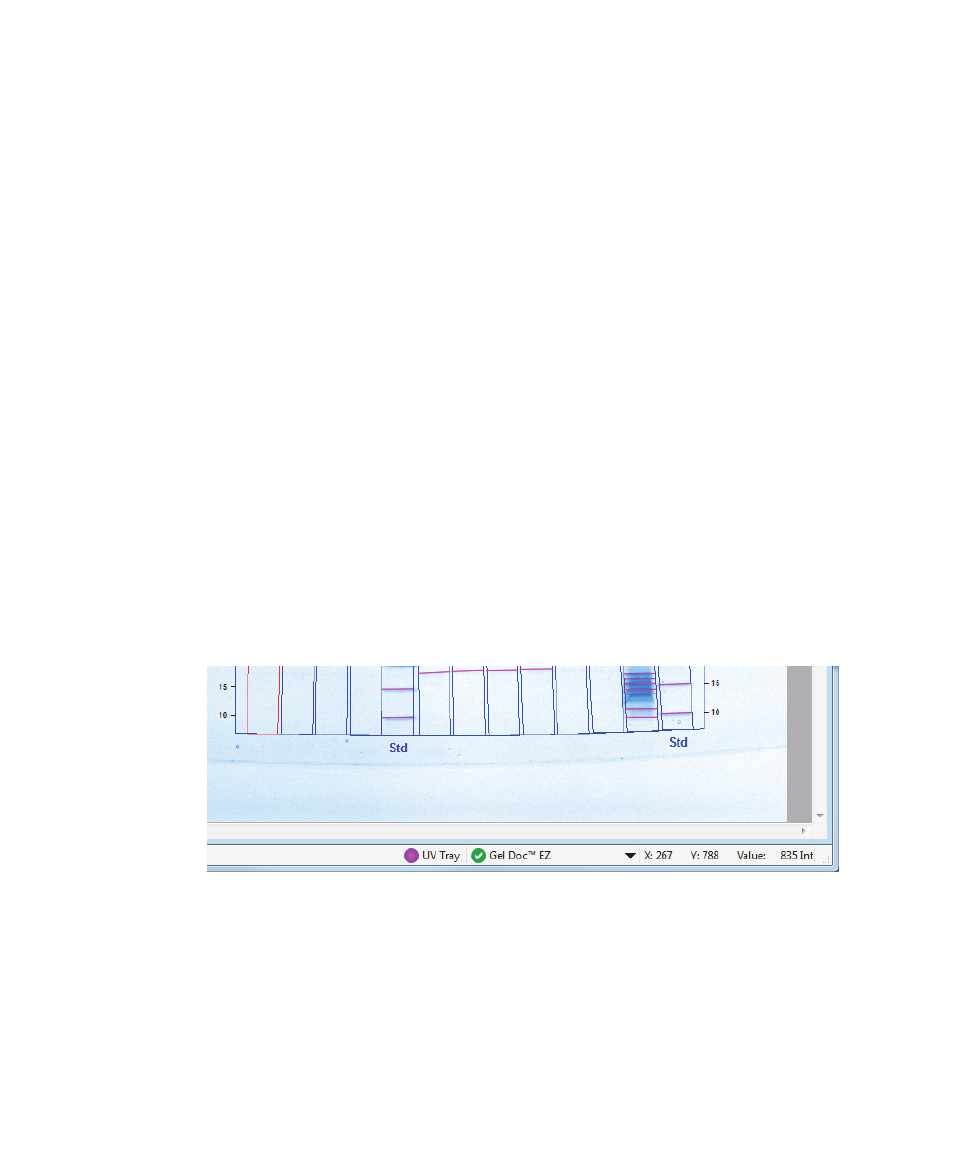
Status Bar
The status bar in the lower right-hand corner of the main window shows the imager
and tray in use, and the X and Y values for the cursor position on the image file.
If the default protocol has been set up for the tray in use, its name also appears in
the status bar next to the tray name. Finally, the Int status bar displays the intensity
value for the image intensity at the cursor position. The maximum data range is
0–4,095, but the range varies depending on the values contained within each image.