Eppendorf BioSpectrometer fluorescence User Manual
Page 54
Methods
Eppendorf BioSpectrometer
®
fluorescence
English (EN)
54
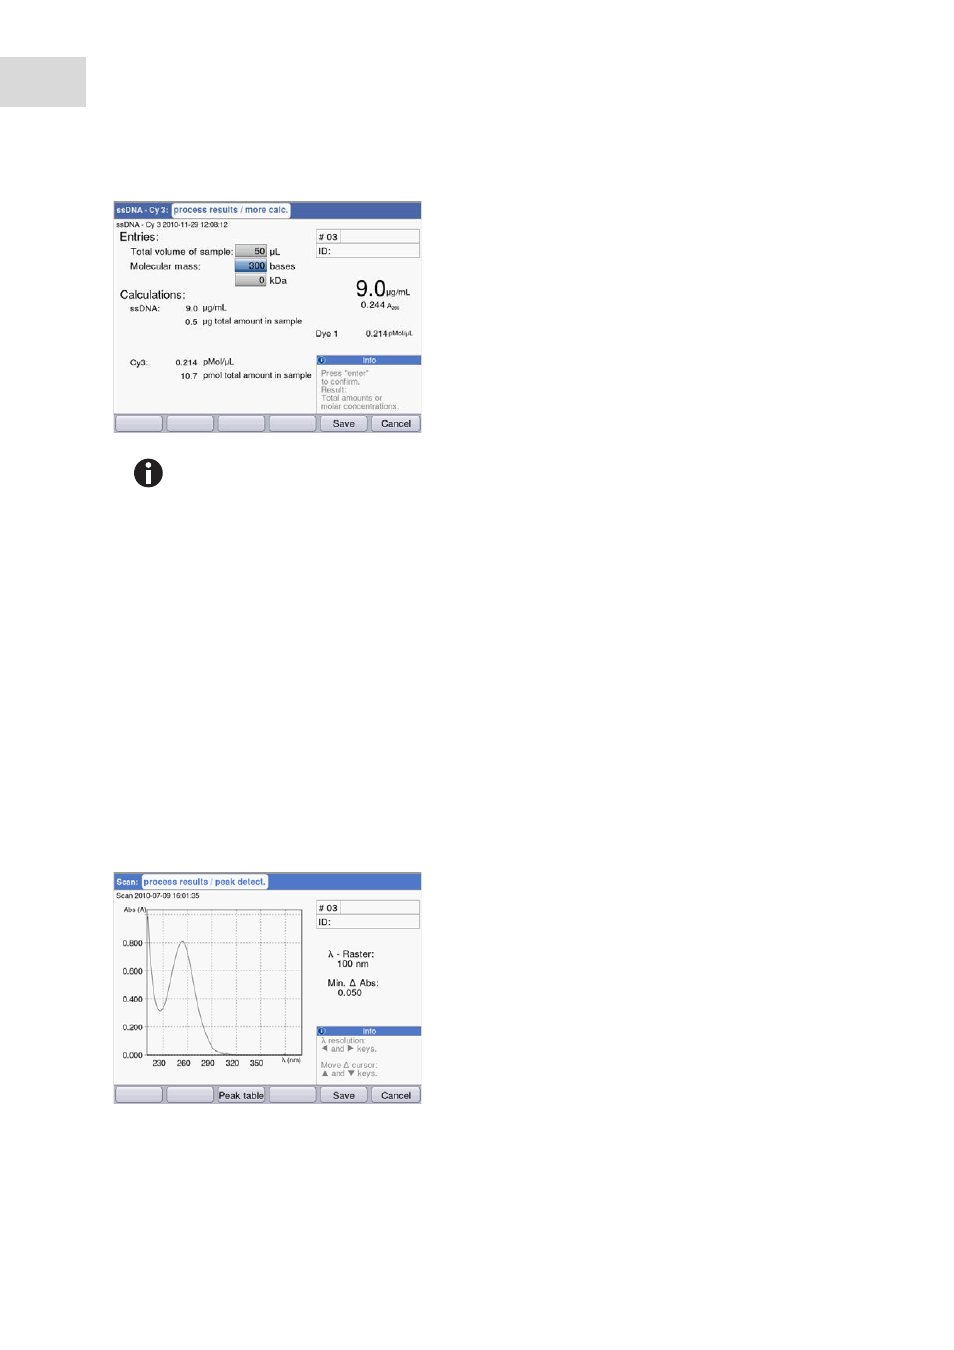
Peak detection
Press the [Peaks] softkey. For the peak detection you can alternate between two criteria:
•
λ grid: Evaluation grid on the wavelength scale for the peak detection (e.g., 10 nm).
10 nm example: The spectra section from -5 nm to +5 nm is evaluated in relation to the peak to be
detected.
•
Min. Δ Abs: Minimum difference between the peak to be detected and the lowest absorbance in the
evaluation grid. No absorbance value in the grid may be higher than the value of the peak at any given
time (e.g.: 0.5).
Examples:
Dye labels method group:
Nucleic acid:
• After the molar mass has been entered (in base/
base pairs or in kDa): Convert the concentration
result to the molar concentration.
• After the sample volume has been entered:
Calculate the total amount in the sample.
Dye:
• After entering the volume of the sample:
Calculate the total amount in the sample.
• For
dsDNA the calculation of the molar concentration is based on the assumption of a
double-stranded nucleic acid. For the
ssDNA, RNA and Oligo methods, a single-stranded
nucleic acid is assumed.
• For methods which have been reprogrammed via
group,
Nucleic acids method group, always double-stranded nucleic acids are assumed
for calculating the molar concentration.
λ grid: 100 nm, min. Δ Abs: 0.050:
The peak is not detected because the λ grid is too
large: The absorbance values on the left edge of the
grid are higher than the absorbance of the peak.