Apple Pages User Manual
Page 158
158
Chapter 9
Creating Charts
To copy data from another spreadsheet into the Chart Data Editor:
1
Open the spreadsheet with the data you want, and select all the relevant cells.
2
Choose Edit > Copy (or press Command-C).
3
Select the top cell in the first column of the Chart Data Editor.
4
Choose Edit > Paste (or press Command-V).
To edit the names of rows and columns, or the data in a cell:
m
Double-click a cell or a row or column label and type.
To reorder rows or columns in the Chart Data Editor:
m
Drag a row or column label and to a new position.
To add rows or columns in the Chart Data Editor, do one of the following:
 Click Add Row or Add Column to place a row above the selected row or a column to
the left of the selected column. If no row or column is selected, the new row or
column appears at the bottom or right edge of the table. (To see the new row or
column, you may have to press the Return key or the Tab key, or expand the Chart
Data Editor window.)
 Select any blank cell, type your data, and press Return. A new row or column is
automatically created.
To delete rows or columns:
m
Select the row or column label and press Delete.
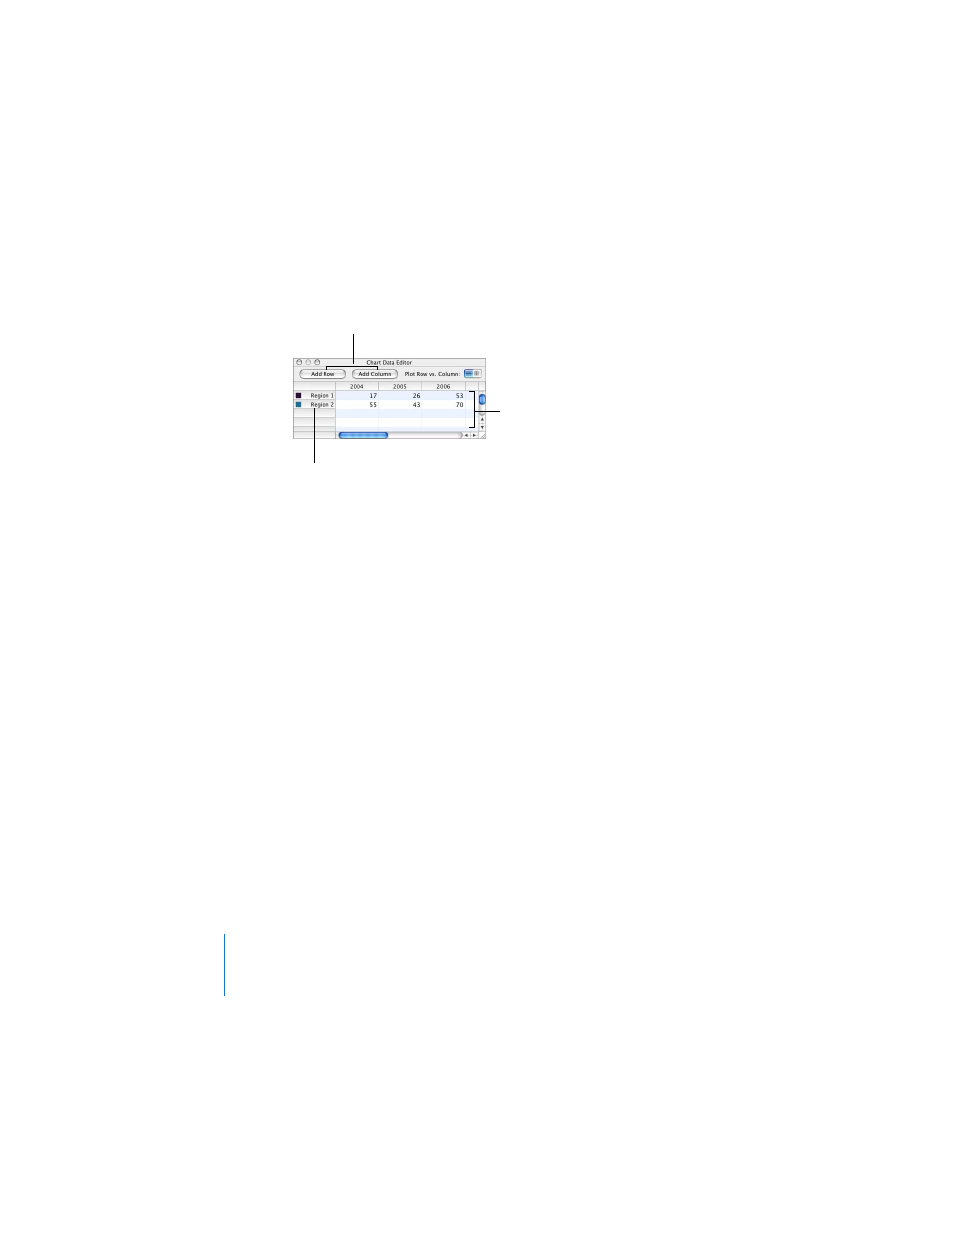
Click these buttons to
add another row or
column for data.
Type chart data directly
into these spreadsheet
cells.
Drag labels to reorder
them.