Viewing alarms in openview – Konica Minolta BIZHUB C30P User Manual
Page 58

Configuring MetaConsole
page 44
Viewing Alarms in OpenView
Note:
The time that is displayed for each alarm is the time the MetaConsole server logged
that alarm, and is based on the MetaConsole server’s time.
To view alarms, follow this procedure:
1
In the OpenView map, right-click a node that is managed by the MetaConsole OpenView
snapin, and on the menu that appears, click Server Configuration. A MetaConsole client
browser window opens (Figure 2.1).
2
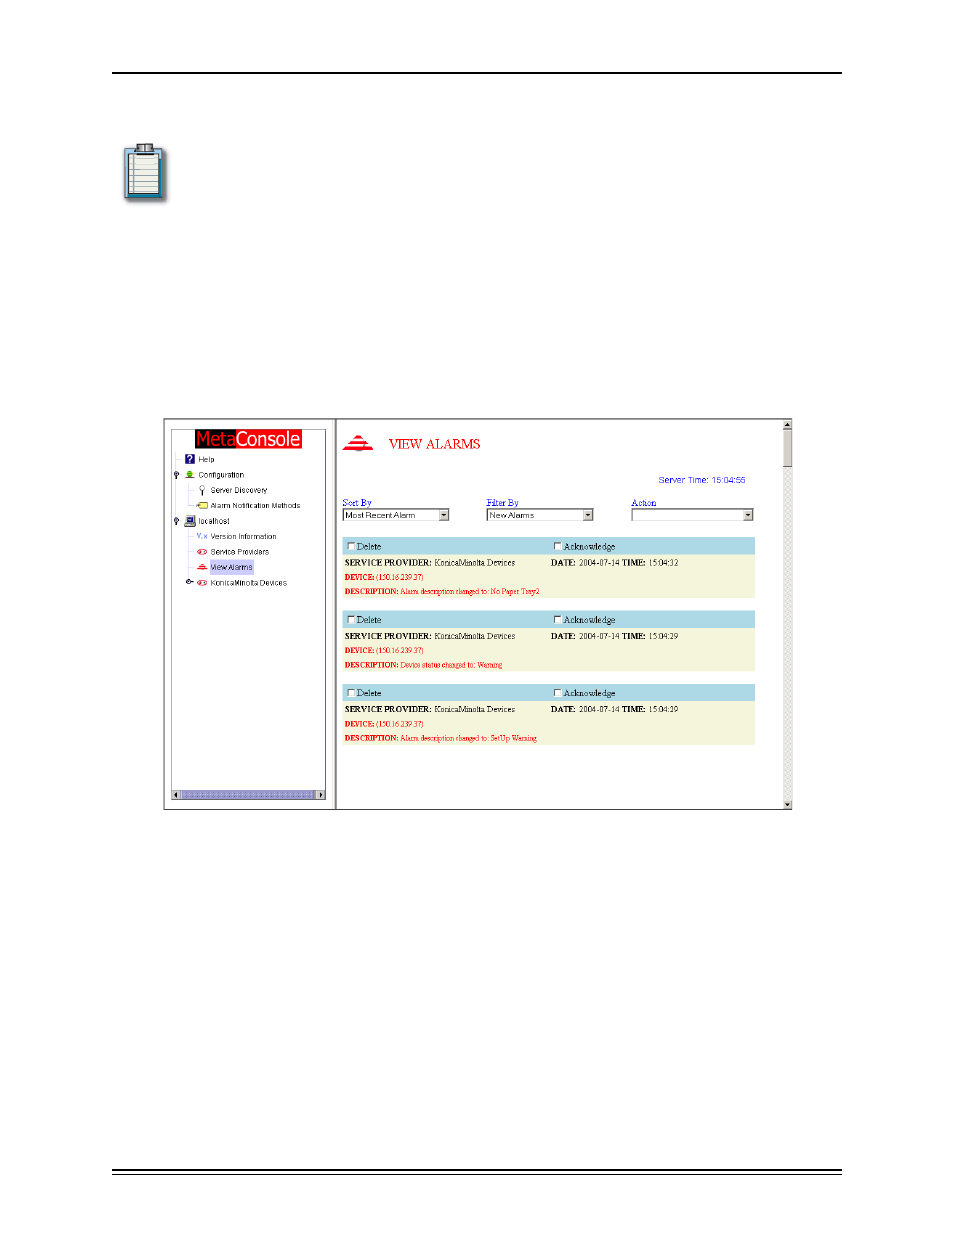
In the navigation pane, click View Alarms. If the database is not configured, a message
indicates that fact. Otherwise, the View Alarms screen opens (Figure 2.9). Alarm log in-
formation for up to 50 alarms is displayed.
Figure 2.9: OpenView: View Alarms Screen
3
To view more alarms, click one of the following in the Action list:
•
Get Next 50 Alarms
•
Get Previous 50 Alarms
•
View All Alarms
If there are a number of alarms in the database, display time will increase.
4
In the Sort by list, click Most Recent Alarm or Device to sort the alarms.
•
Most Recent Alarm shows the most recent alarms at the top of the page and older
alarms at the bottom.
