Konica Minolta Darwin VDP Software User Manual
Page 77
expenses for 2007 and 2008, so we need two series: series 1 for 2007
and series 2 for 2008.
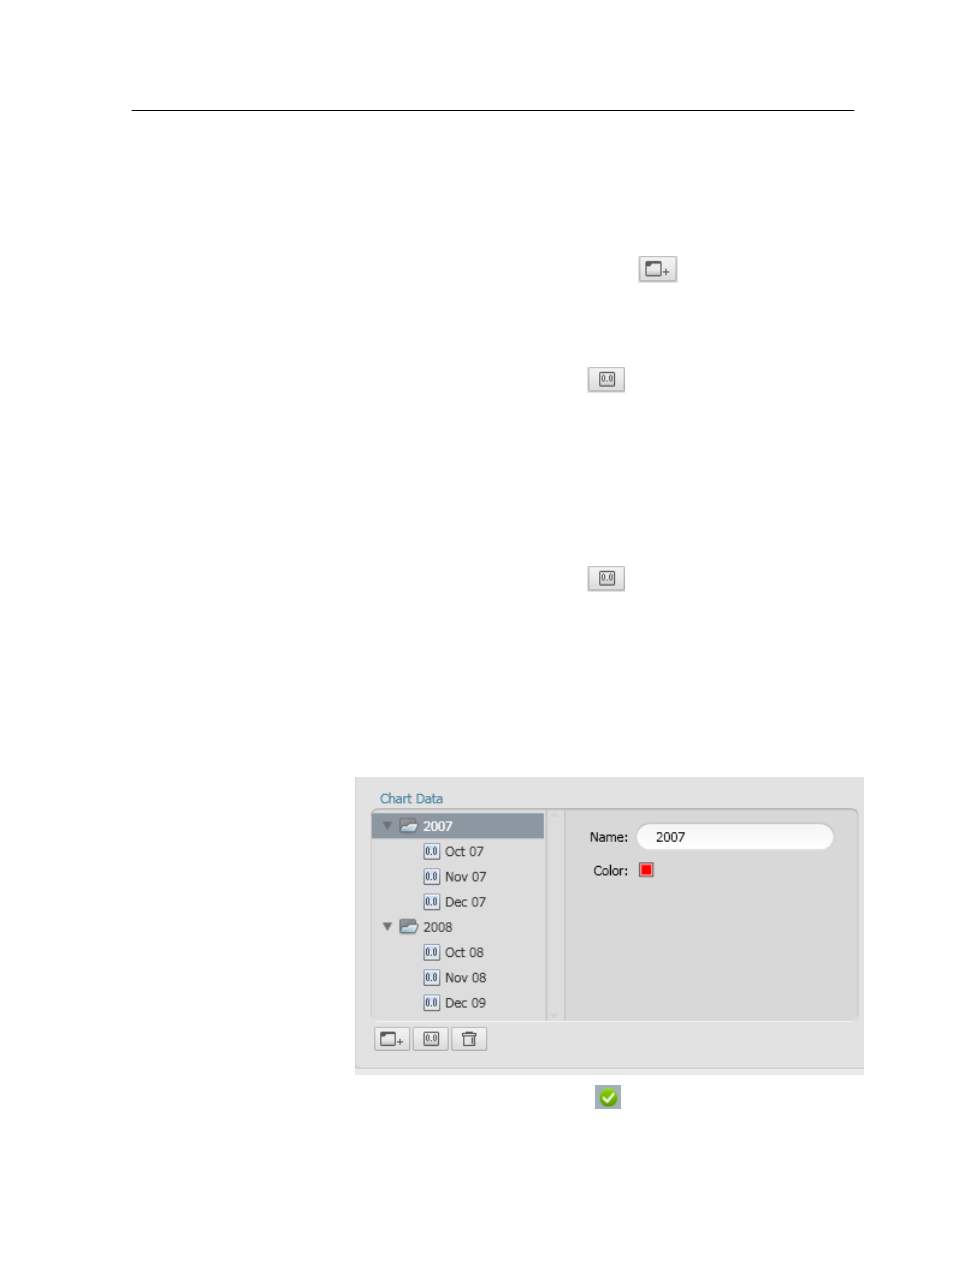
1. To name Series 1, under Chart Data, in the Name box, type the
required name for your series. In this example, type
2007
.
2. To add another series, click Add Series
.
3. Make sure that Series 2 is selected and then in the Name box, type
the required name. In this example, type
2008
.
4. Select Series 1.
5. Click Add Fields and Functions
, and select the fields that you
want to show in the chart. In this example, select the following
fields: Oct 07, Nov 07, and Dec 07.
The required fields are assigned to Series 1.
6. Click the Color box.
7. In the Select Color window that appears, select a color for the
column of series 1 and click Ok.
8. Select Series 2.
9. Click Add Fields and Functions
, and select the fields that you
want to show in the chart. In this example, select the following
fields: Oct 08, Nov 08, and Dec 08.
Note: If you have multiple series, only the names of the fields in
Series 1 will be displayed as labels on the X-axis.
10. Click the Color box.
11. In the Select Color window that appears, select a color for the
column of series 2 and click Ok.
12. On the T
ools panel, click Accept
.
13. From the File menu, select Save.
Defining the chart data
69