Defining the chart data – Konica Minolta Darwin VDP Software User Manual
Page 76
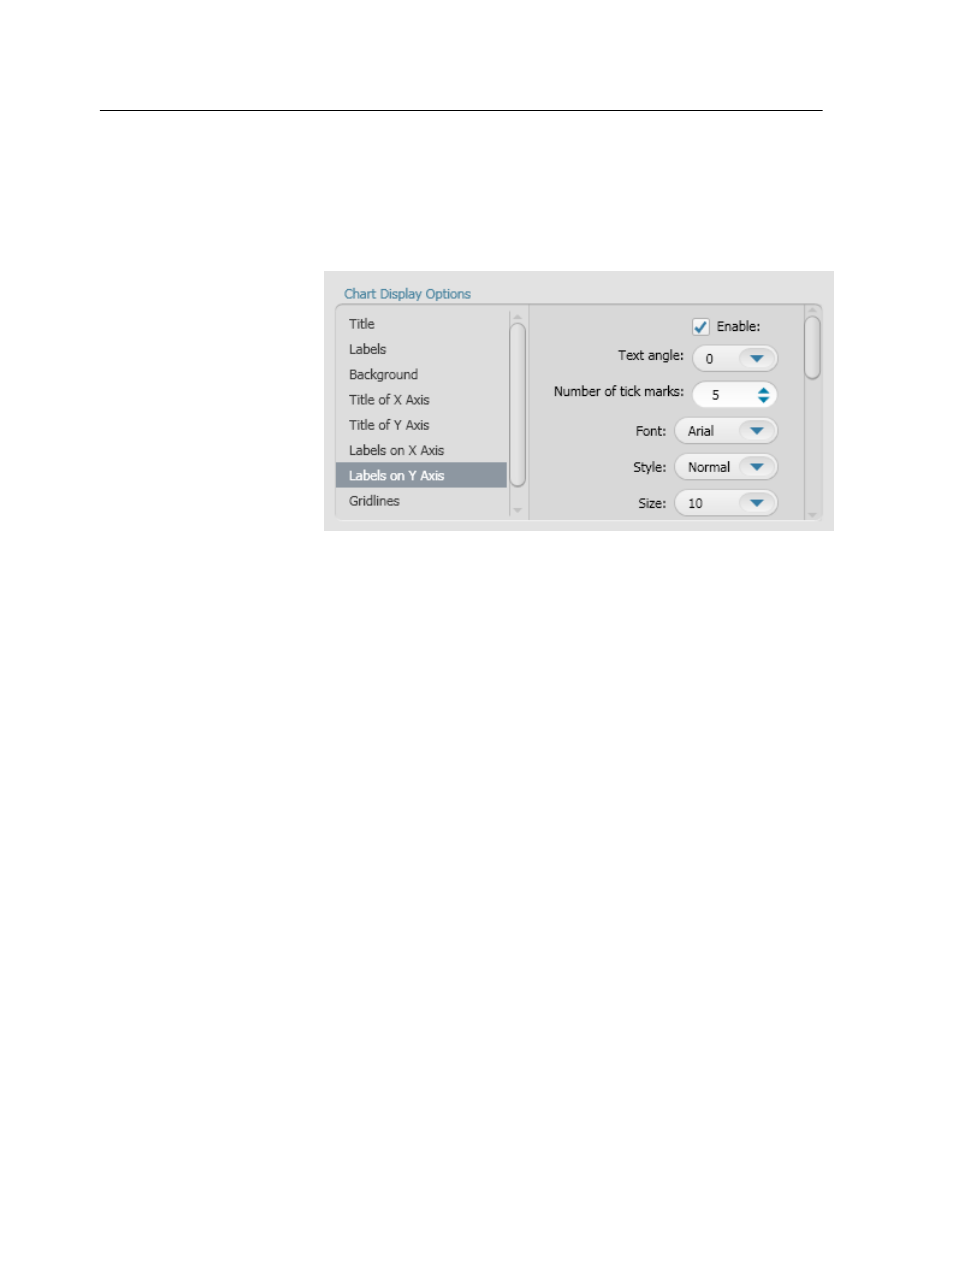
a. If you want to display labels on the Y axis, make sure that the
Enable check box is selected.
b. Define the angle of the labels, font, style, size, and color for the
labels on the Y-axis. In addition, you can define the number of
tick marks. In this example, keep the default values.
8. Select Gridlines. In the Gridlines list, you can select one of the
following options:
●
None—no gridlines are displayed
●
X Axis—only the X-axis gridlines are displayed
●
Y Axis—only the Y-axis gridlines are displayed
●
X and Y Axes—both the X-Axis and Y-axis gridlines are displayed
9. In this example, select the X and Y Axes.
10. Select Chart Dimensions.
11. In the Width and Height boxes, type the required values in
millimeters. In this example, keep the default values.
Note: Make sure that the width and height values that you set in the
Chart Dimensions area are identical to the width and height values
of the InDesign CS3 page box that will contain the chart.
You have completed defining the chart display options, now you will
learn how to define the chart data.
Defining the chart data
In the Chart Data area, you define the series and fields that will apear in
the chart.
Each series is a folder that contains the fields that you want to use in
your chart. Depending on the type of chart that you want to use, you
can add as many series as you want and assign fields accordingly. In
this example, we want to create a chart that compares last quarter
68
Chapter 9—Working with charts