System view & trends – Bell & Gossett 10-001-275 XLS Integrated Pump Controller User Manual
Page 12
12
SYSTEM VIEW & TRENDS
By tapping
from home screen, System
View accesses color-coded operational
trends or historical data for several system
variables such as flow, pressure, speed, and
setpoint.
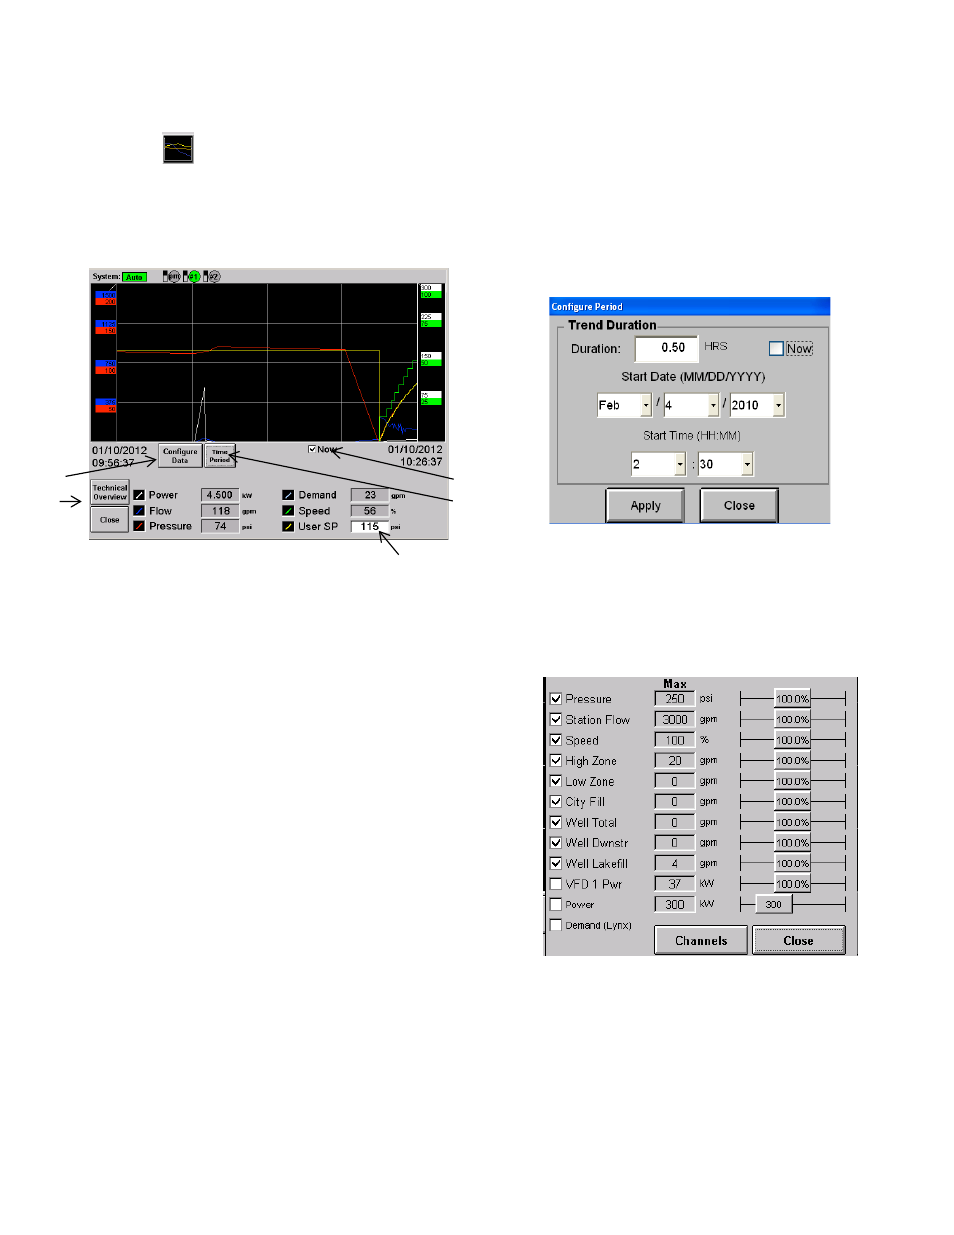
Figure 22: Trends Screen
You can turn on and off logged channels on the
viewer by tapping any of the values at the
bottom of the screen.
Power readings may not be available on all systems.
Also on some systems a power reading of 0 will
cause the Power display to disappear, and will
reappear when power readings return.
a. The trends will be shown for the Duration
value, ending at the current time. When ‘Now’
is checked, the system defaults to the current
date and time.
If ‘Now’ has been checked, ‘Duration’ is the
only editable field under [Time Period]. For
viewing historical data, uncheck ‘Now’.
Enter the start date and time, along with
duration to view data for desired time. Tap
[Apply] to apply changes or [Close] to cancel
any changes.
NOTE: If ‘Now’ is left unchecked, the system
does not default back to the current date and
time.
b. User SP field
By tapping in the “User SP” from the System
View you can adjust the system Normal Set
Point.
c. Time Period
By tapping [Time Period] from the System
View an enhanced screen allows you to set a
date and duration for viewing system
information.
Figure 23: Configure Period
d. Configure Data
By tapping [Configure Data] for the System View
menu will bring up an enhanced screen that will
allow you to change way the data is displayed
on the trends screen.
Figure 2 4 : Configure Data
Check the box next to the data you want to
show. Not all data is available for all systems.
Use the slider bar on the right to adjust the
graph scaling to a value that makes it most
comfortable to read.
100% means the graph scale is the same as
the analog scaling max value. 110% means
the graph scaling is 110% of the analog max
c
b
e
d
a