6 use the triage space pane, The triage space pane at a glance, Use the triage space – HP Neoview Release 2.4 Software User Manual
Page 65: Pane

6 Use the Triage Space Pane
The Triage Space isolates queries you select in the Neoview view and customized views for
analysis in the Query Workbench. Triage Space information comes from the Repository.
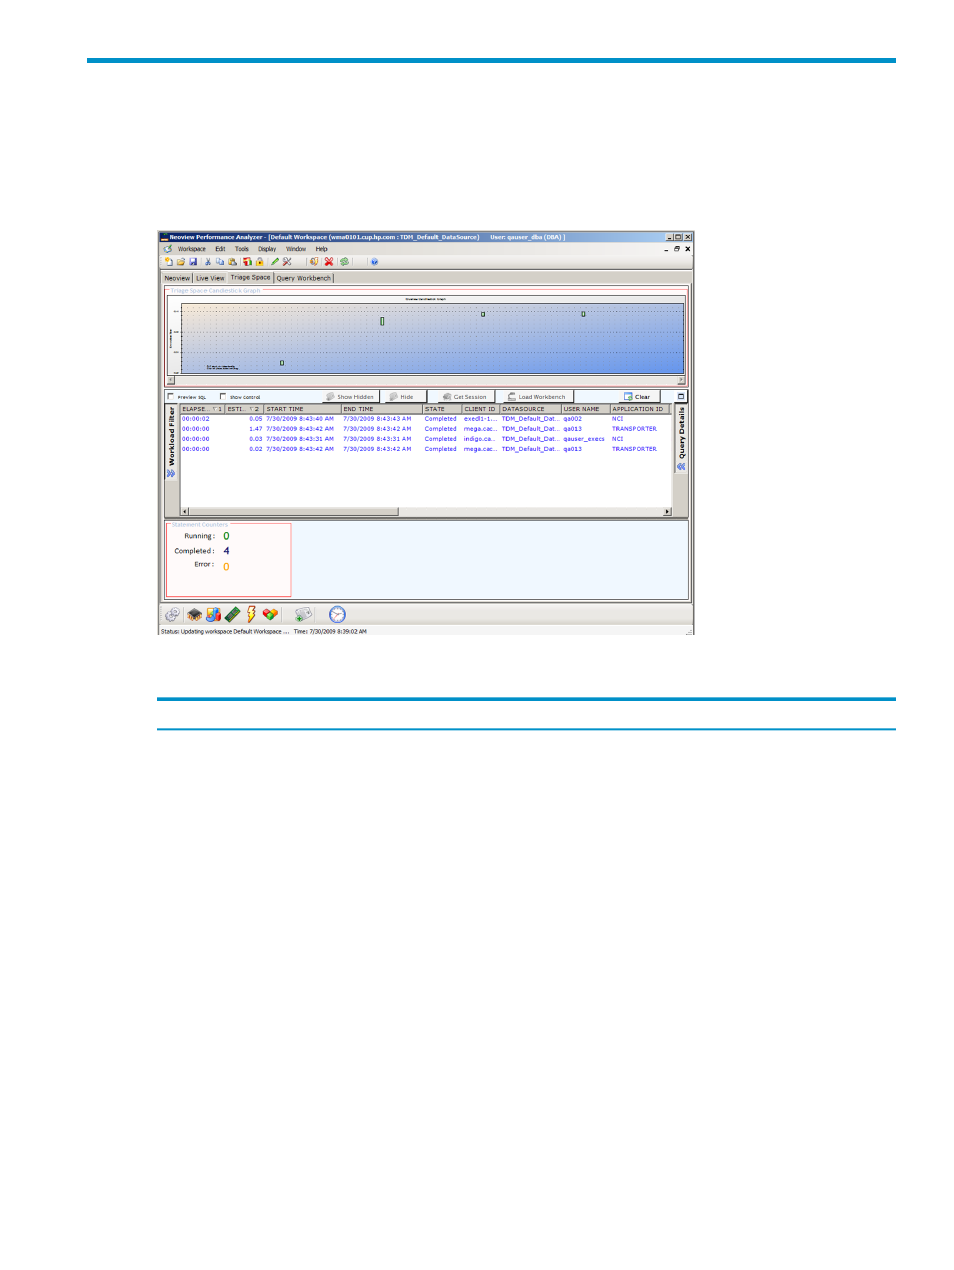
The Triage Space Pane At a Glance
The Triage Space pane contains several parts:
Description
Triage Space Pane Part
Shows a graphical step graph view of the queries represented in the
table grid. If you click on one of the bars in the top grid, the query
associated with the bar is highlighted in the table grid. If you mouse
over a bar, NPA shows you when the query started and how long it
took. See
.
Query Candlestick Graph
The checkboxes and buttons on the Triage Space button panel let you
control certain characteristics of your display. The commands are
Preview SQL, Hide, Show Hidden, Get Session, Load Workbench, Clear,
and Default Size/Maximize. See the
.
Triage Space button panel
Shows the properties filters. Click on the Workload Filter bar to the left
side of the table grid to show the filters. See
Workload Filter
A table area that shows the queries you selected in the Neoview Pane.
You can resize the table grid. Additionally, the fetch limit setting for
the Triage Space is 20000. You can change the fetch limit (Triage Space
Settings Fetch Limit
) by choosing the Tools>Options selection. See
.
Triage Space data grid
A bar on the right side of the screen that pops up a list of query details.
See
.
Query Details
On the bottom of the screen, provides summary information about the
queries that are shown in the Triage Space. See
.
Statement Counters
The Triage Space Pane At a Glance
65
