4 use the neoview pane, Neoview and customized views, The neoview pane at a glance – HP Neoview Release 2.4 Software User Manual
Page 27: Select content to analyze, Use the neoview, Pane

4 Use the Neoview Pane
Neoview and Customized Views
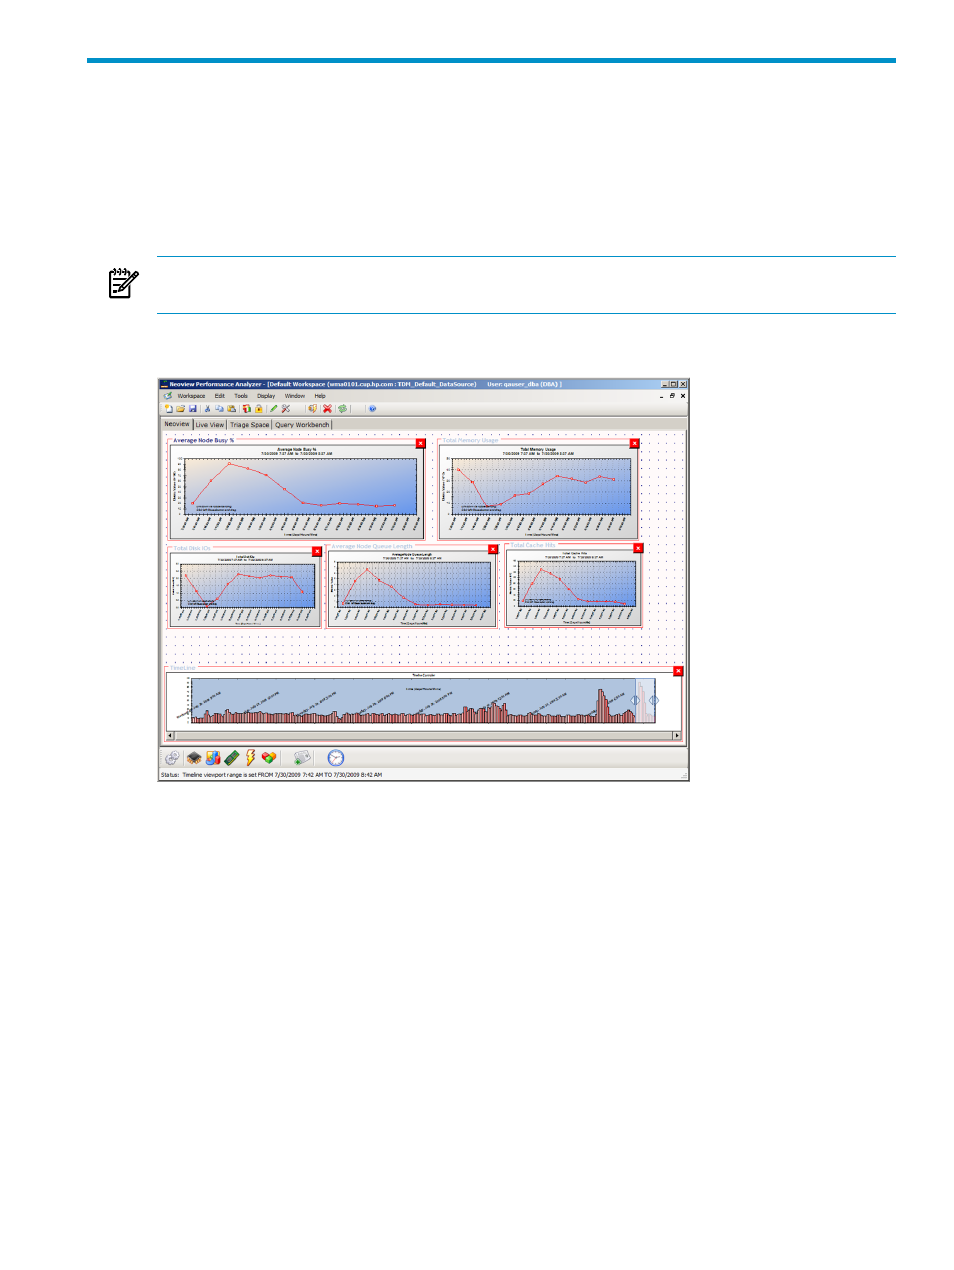
The Neoview and customized views allow you to define which system and workload metrics
you want to display in the workspace content area. Through the use of views, you can switch
between different layout types and make performance decisions on the resource usage of the
system and the areas and workload that need to be investigated and optimized.
NOTE:
To view graph information, you must turn on Fetch Timeline Information in the
Tools>Options
settings. See
The Neoview Pane At a Glance
Use the Neoview pane to select the information you want to analyze by adding tools to the
workspace. To add a tool, drag and drop the tool to the workspace content area. The available
tools:
•
System Metrics
•
Processing Node Utilization
•
Processing Node Queue Length
•
Memory Usage
•
Cache Hits
•
System I/O Activity
•
Workload Metrics
•
Timeline Controller
For details about the tools, see
.
Select Content to Analyze
In the Neoview or customized views, you have full control over the performance metrics to be
displayed. You can use the workspace toolbox to drag and drop as many tools as you want onto
the content area and rearrange and resize the graphs. The type of tool and the performance metric
Neoview and Customized Views
27
