Get query text, At-a-glance system summary information, Statement counter summary information – HP Neoview Release 2.4 Software User Manual
Page 44

Description
Metric
Number of rows returned after applying the predicates. In a push
down plan, all the used rows may not be returned.
UsedRows
Count of the messages.
MessageCount
Count of the message bytes sent to access the tables in this statement.
MessageBytes
Number of disk reads for accessing the tables referenced in this
statement.
DiskIOs
Displays the number of times this statement had to wait on a
conflicting lock. If this field is 0, no locks were encountered during
the processing of this statement.
LockWaits
The number of times row locks escalated to a file lock during the
execution of this statement. If this field is 0, no locks were escalated
during this statement execution.
LockEscalations
An approximation of the total CPU time spent for executing the
given query.
DiskProcessBusyTime
Number of OPEN calls performed by the SQL executor on behalf of
this statement.
Opens
Time this process spent doing OPENs on behalf of this statement.
OpenTime
An internal counter indicating the last time (internal form) when
the per-table statistics were updated.
LastUpdated
Get Query Text
Get Query Text
provides the ability to retrieve the query text associated with the query being
monitored (watched). This tool contains a text box which “hosts” the query text, a control to turn
on/off the formatting of the query text and the Get Query Text button. Get Query Text retrieves
the query text from the repository.
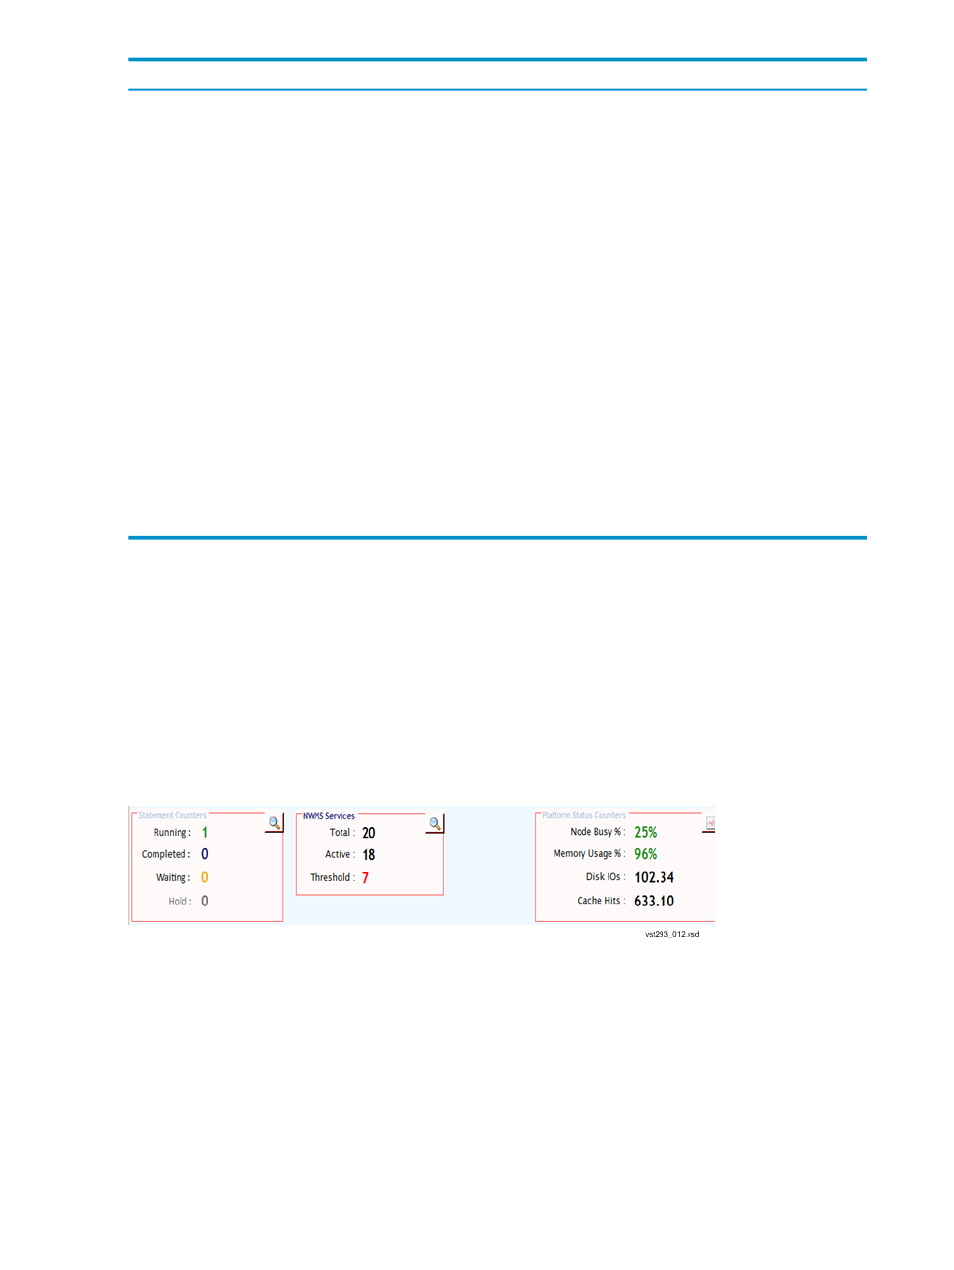
At-A-Glance System Summary Information
The top pane of the Live View application contains a grid that shows a live listing of the queries
running on the Neoview platform. Just below this pane is a system summary information pane,
which provides an at-a-glance view of statement counters, services, and platform status counters.
Statement Counter Summary Information
Statement Counters provide summary information about the queries that are currently displayed
in Live View. These counters are indicator values of queries that are running, completed, in
waiting, and in hold states in the Neoview WMS queues. This information provides a summary
view of the current state of queries running and managed by Neoview WMS. The recently
completed query counter information is aged out based on the default Neoview WMS settings
(1 minute) – that is, queries that completed within the last minute or 60 seconds will be shown
in the Live View and the Completed counter value will be the corresponding value (or count of
the completed queries).
44
Use the Live View Pane
