Viewing thumbnail histograms (histicons) – Teledyne LeCroy WavePro 7 Zi_Zi-A User Manual
Page 108
WavePro 7 Zi/Zi-A Oscilloscopes
100
922137-00 Rev A
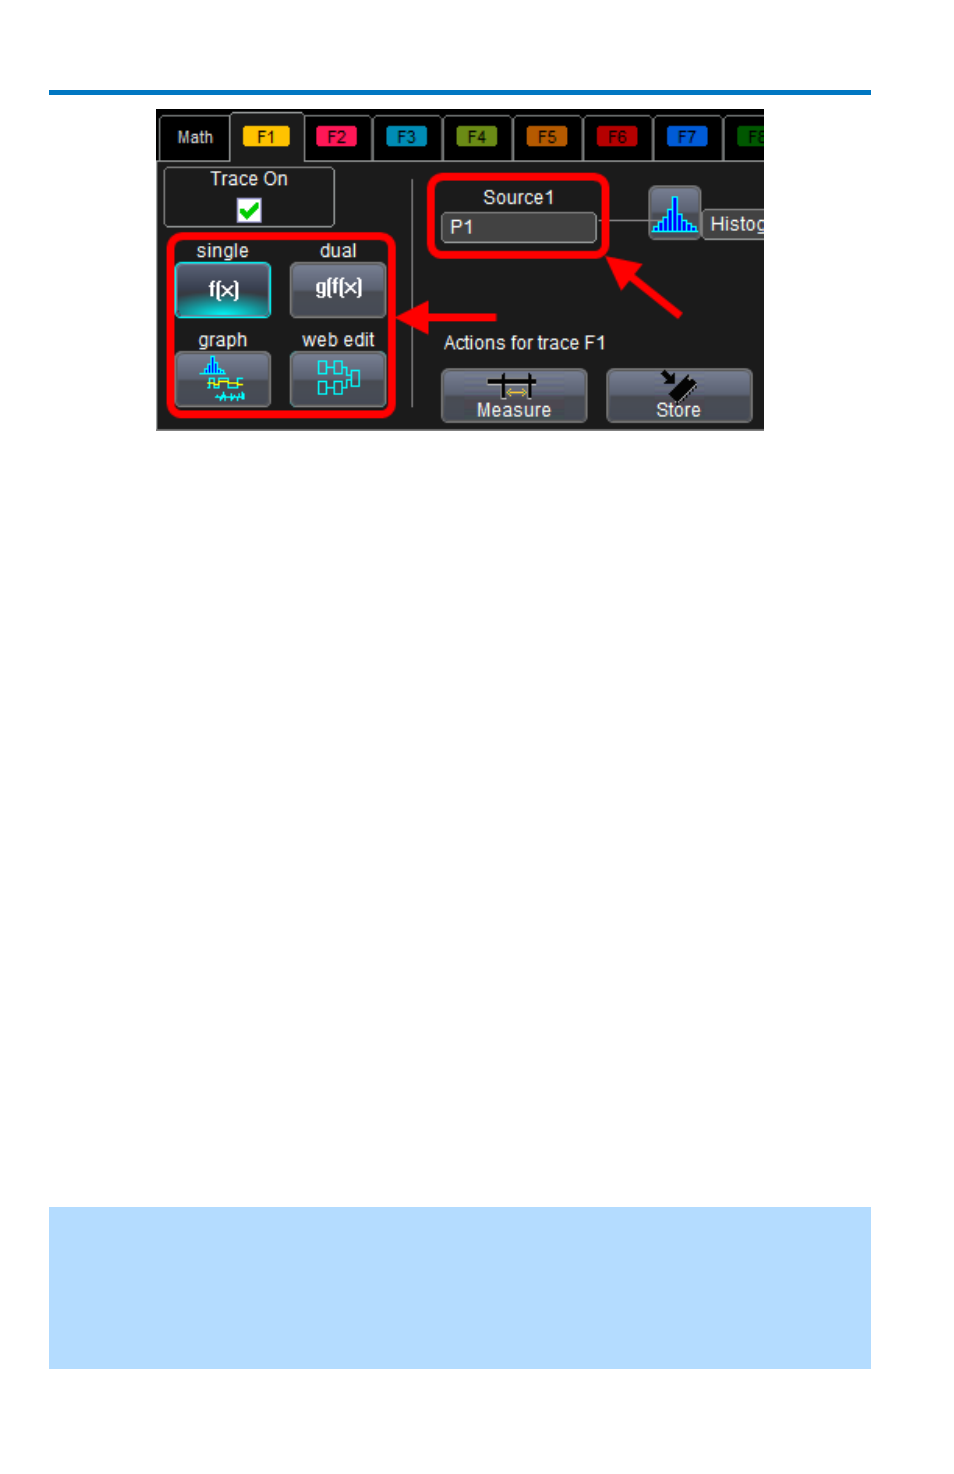
You can modify the source of your waveform used on a Math trace
using the source (Source 1) control.
On the far left of the Fx dialog, the single and dual buttons are
available for one math function or math-on-math, respectively.
The web edit button is used to access the Processing Web and
sequence highly-detailed math functionality.
Touch the Graph button, and then touch inside the Graph with
control to select a graph mode (in this case Histogram).
At this point, access the Histogram right-hand dialog by touching the
Histogram tab on the far-right of the screen. Follow the final 1 - 4 steps in
the previous Single Parameter Histogram Setup Using Measure
instructions.
Viewing Thumbnail Histograms (Histicons)
Histicons are miniature histograms of parameter measurements that
appear below the grid. These thumbnail histograms let you see at a glance
the statistical distribution of each parameter.
1. On the menu bar, touch Measure, then one of the Measure Mode
buttons: Std Vertical, Std Horizontal, or My Measure.
2. Touch the Histicons checkbox to display thumbnail histograms
below the selected parameters.
Note: For measurements set up in My Measure, you can quickly display an
enlarged histogram of a thumbnail histogram by touching the Histicon you
want to enlarge. The enlarged histogram appears superimposed on the
trace it describes. This does not apply to Std Vertical or Std Horizontal
measurements.