Creating and viewing a histogram, Wavepro 7 zi/zi-a oscilloscopes – Teledyne LeCroy WavePro 7 Zi_Zi-A User Manual
Page 104
WavePro 7 Zi/Zi-A Oscilloscopes
96
922137-00 Rev A
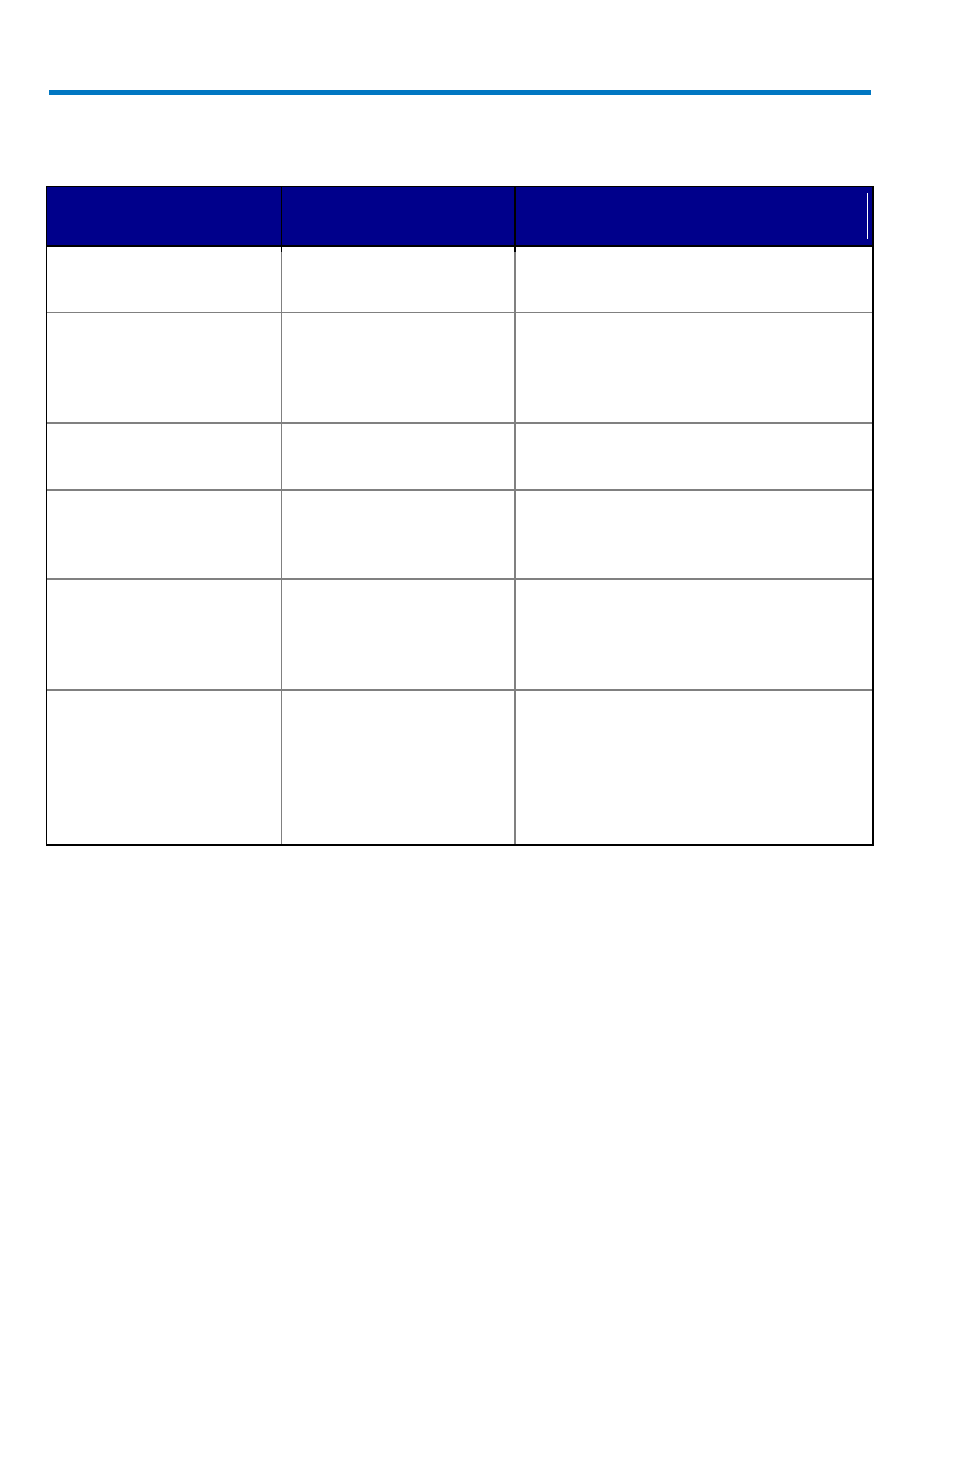
Differences between Track and Trend are summarized in the following
table:
Characteristic
Track
Trend
Representation
Parameter value vs.
time
Parameter value vs. event
Behavior
Non-cumulative
(resets after every
acquisition). Unlimited
number of events
Cumulative over several acquisitions
up to 1 million events
Time Correlation to
Other Data
Yes
No
Monitors an Evolution
in the Frequency
Domain
Yes
No. Trend points are not evenly
spaced in time and therefore cannot
be used for an FFT.
Monitors the Evolution
of a Measurement
Parameter over
Several Acquisitions
No. Track resets after
every acquisition.
Yes
Ensures No Lost
Measurement Data
Yes. Maximum time
period that can be
captured is limited by
acquisition memory
and sampling rate.
No. Since data can be accumulated
over many acquisitions, and since
the oscilloscope takes time to
calculate measurement values and to
display data before the trigger is re-
armed, data can be missed.
In general, Track is the tool to use if you want to capture a continuous
stream of data spaced closely together. To understand the change in a
parameter with time, Trend can be used if your data is spaced widely apart
and longer than the dead-time of the oscilloscope between acquisitions.
Think of Trend as a strip chart recorder for your oscilloscope.
Creating and Viewing a Histogram
Histograms are graphical representations of data which divides it into
intervals or bins. These intervals/bins are plotted on a bar chart such that
the bar height relates to the number of data points inside each interval/bin.
Various histograms can be setup using Measure or Math dialogs.
Thumbnail versions of Histograms are called Histicons. Also, Persistence
can be applied to Histograms.