Scrolling a bar graph, Scaling a bar graph to show all data – PASCO SPARK Science Learning System Ver. 1.4.0 User's Guide User Manual
Page 48
5 Data display
Displaying data in a bar graph
Scaling a bar graph by expanding or compressing the axes
Scrolling a bar graph
To scroll and change the view of a bar graph, touch the middle of the graph and drag it up,
down, side-to-side, or diagonally. Note: touching a bar will not scroll the screen. Instead, it will
open the graph edit menu. Turning off the bar edit tools will prevent this from occurring, allow-
ing the screen to be scrolled without this menu opening up.
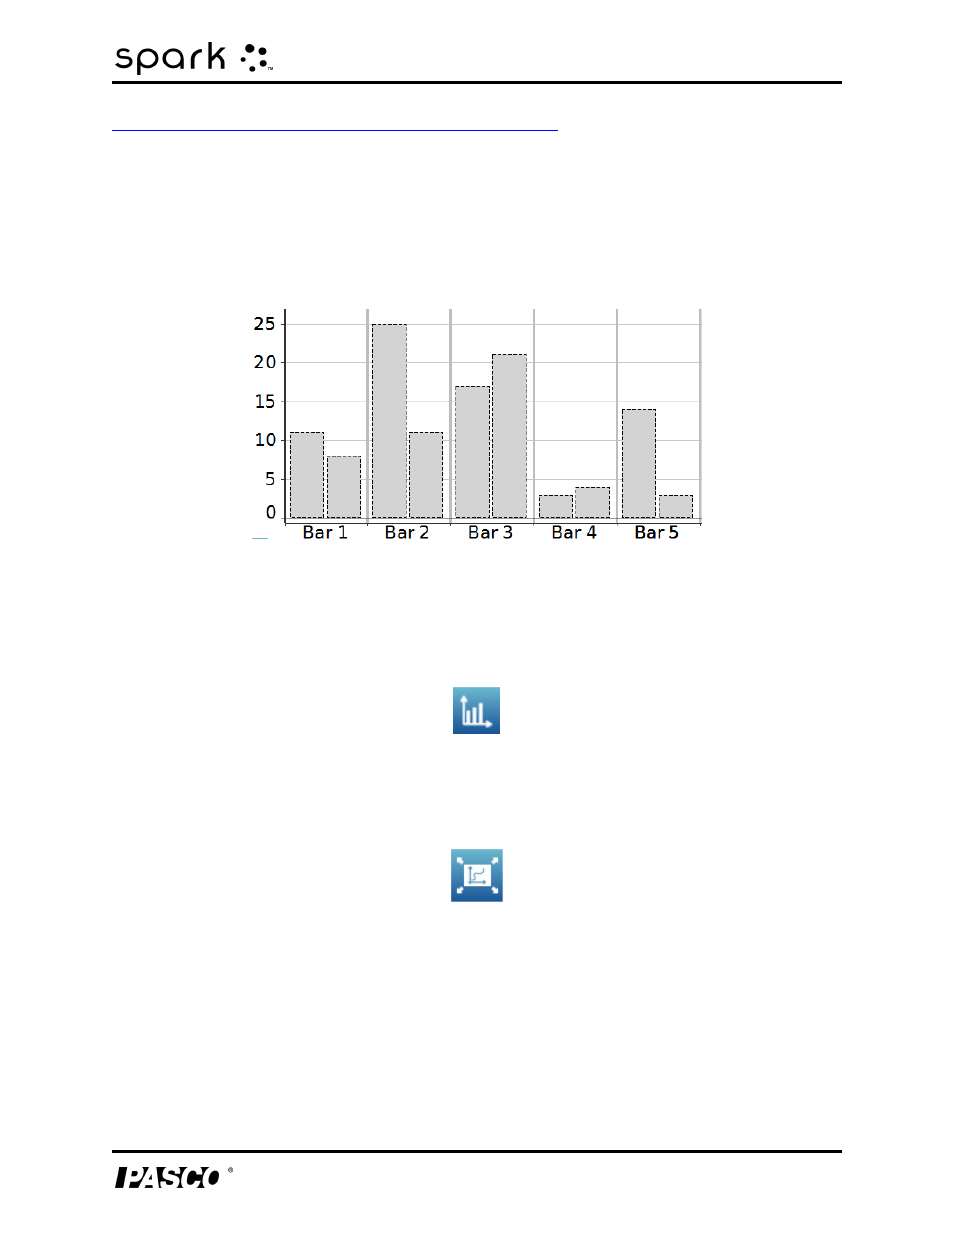
Scaling a bar graph to show all data
1. If necessary, touch the
Bar Graph Tools button to open the tool palette.
2. Touch the
Scale-to-fit button.
The graph adjusts to fit all data (or selected data).
Scaling a bar graph by expanding or compressing the axes
You can change the scale of a bar graph by expanding or compressing the X-axis, Y-axis, or
both. To do this, complete one or both of the following actions:
l
Touch one of the labels on the X-axis and drag horizontally (left or right).
The graph expands or contracts horizontally, making each bar area wider or narrower.
012-10616E
39