Luminex 100 IS User Manual, Version 2.3 User Manual
Page 58
Luminex 100 IS User Manual Version 2.3
x
MAP Technology
5 - 16
PN 89-00002-00-071 Rev. C
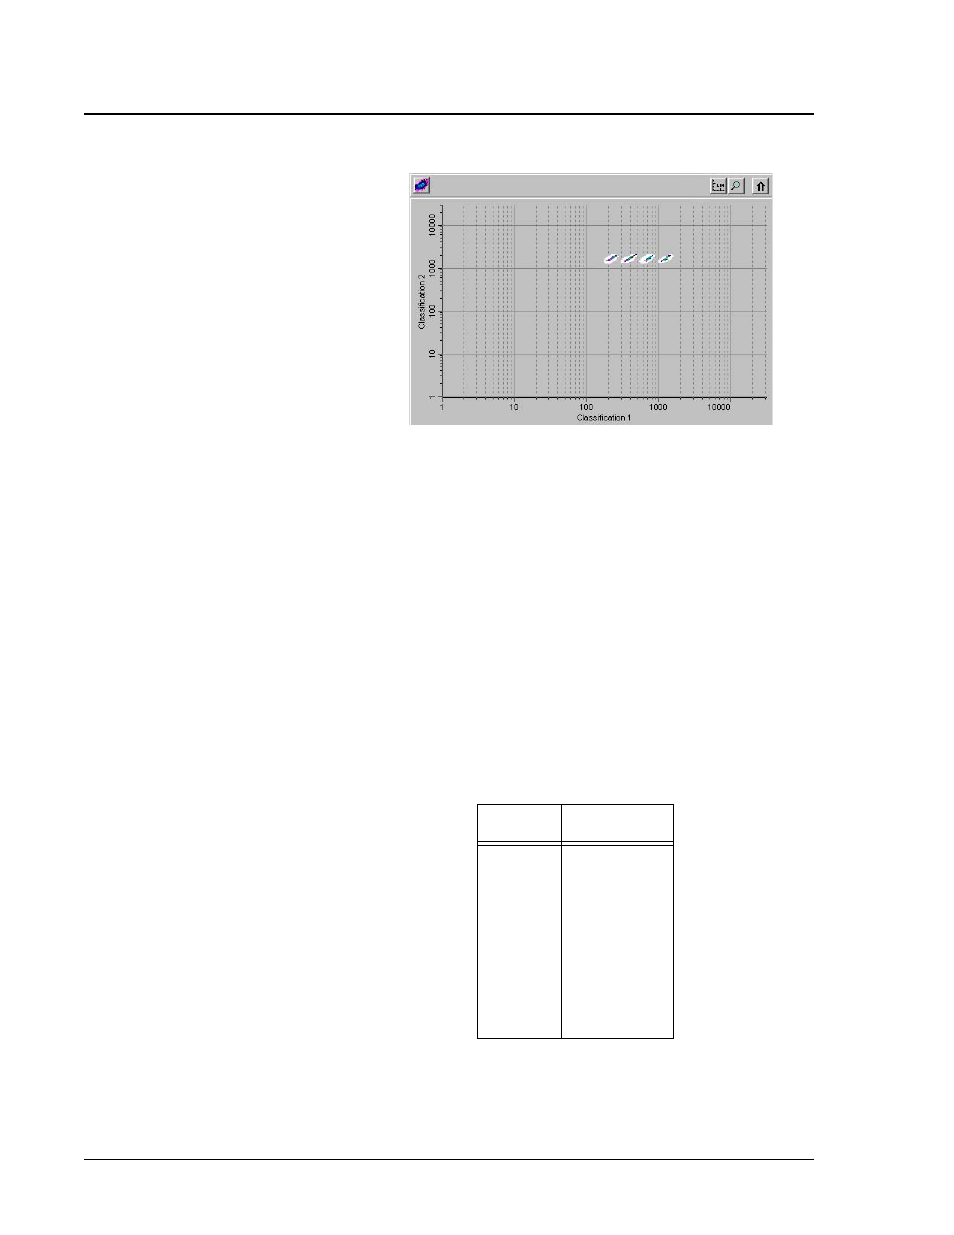
Figure 5-14. Dot Plot Display Example
Four buttons appear at the top of the frame to control the display:
• Density/Decaying
• Log/Linear
• Zoom
• Maximize
You can toggle between two types of dot plots using the Density/
Decaying button. The Decaying Dot Plot plots only the 100 most-
recent acquired events. The Density Dot Plot displays a constant
accumulation of events. Increasing density is indicated by
contrasting colors. See Table 5-2 for the density dot plot color
legend.
The density dot plot allows visual elimination of data values
determined to be insignificant to the display. Luminex recommends
you collect your data in density dot plot mode to observe all
Table 5-2. Dot Plot Color Legend
Layer
Color
0
1
2
3
4
5
6
7
8
none
dark blue
pink
dark green
cyan
light blue
light green
orange
dark red