Luminex 100 IS Version 2.1 User Manual
Page 25
x
MAP Technology
Luminex xMAP Technology
PN 89-00002-00-062 Rev. A
19
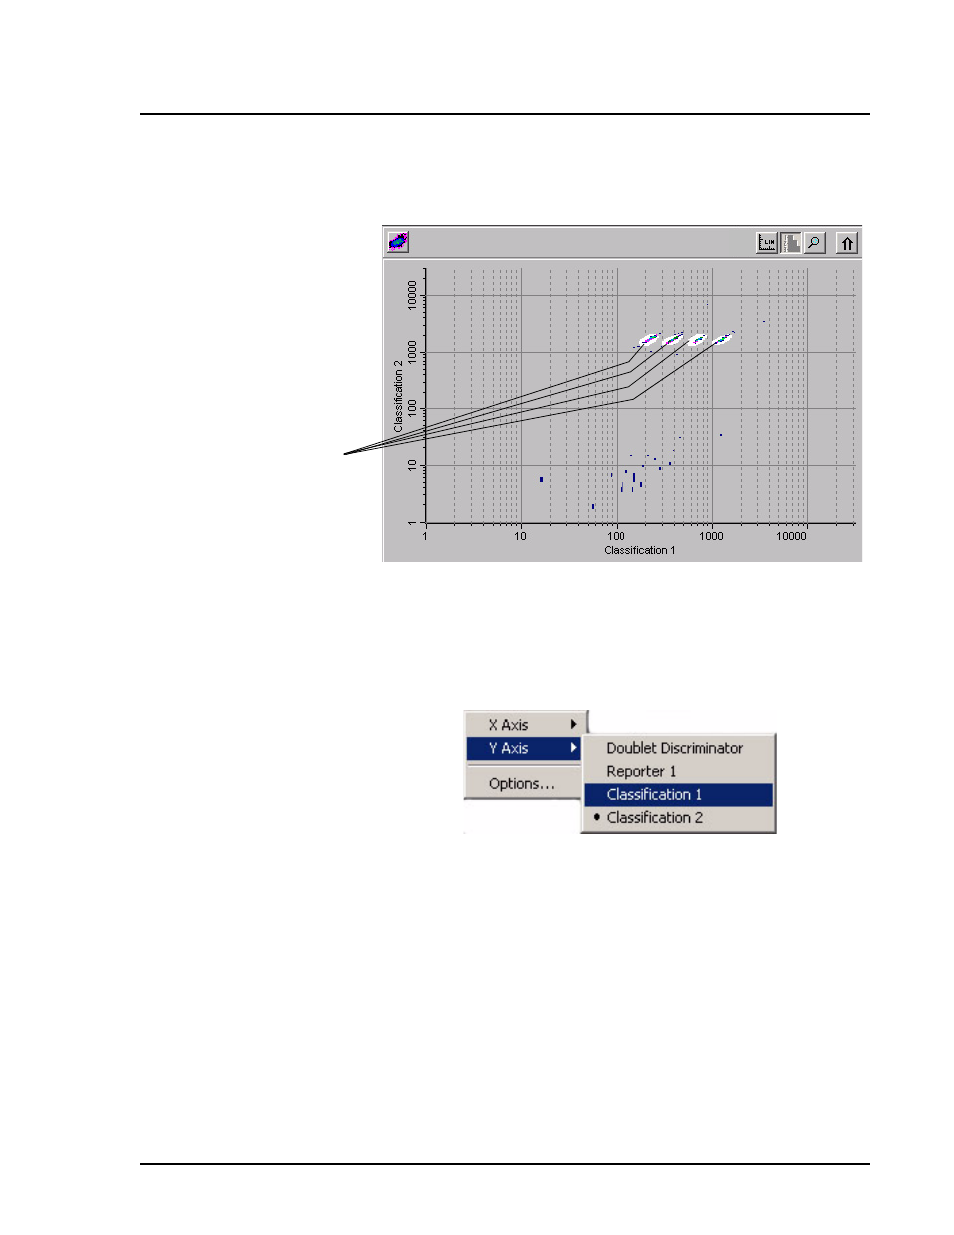
see the Dot Plot, you must use the default axis. To display the bead
set information, hover the mouse pointer over the desired region.
Figure 8. Dot Plot Display Example
To change the Y axis category:
1. Right-click anywhere in the Dot Plot to display the pull-down
menu.
Figure 9. Dot Plot Pull-Down Menu
2. Select the Y Axis entry, then select the desired value from the
list.
To change the X axis category:
1. Right-click anywhere in the Dot Plot to display the pull-down
menu.
2. Select the X Axis entry, then select the desired value from the
list.
Hover the mouse
pointer over a
region to display
the bead name
Note:
You may want to change the
X axis and Y axis of the Dot Plot for
troubleshooting purposes. We highly
recommend using the default
settings in all other instances.