Luminex 100 IS Version 2.3 User Manual
Page 122
Luminex 100 IS User Manual Version 2.3
x
MAP Technology
5 - 80
PN 89-00002-00-072 Rev. C
Grid in front of data: Check this option to place the grid in
front of the data graphics. Otherwise, the data graphics are
drawn on top of the grid.
•
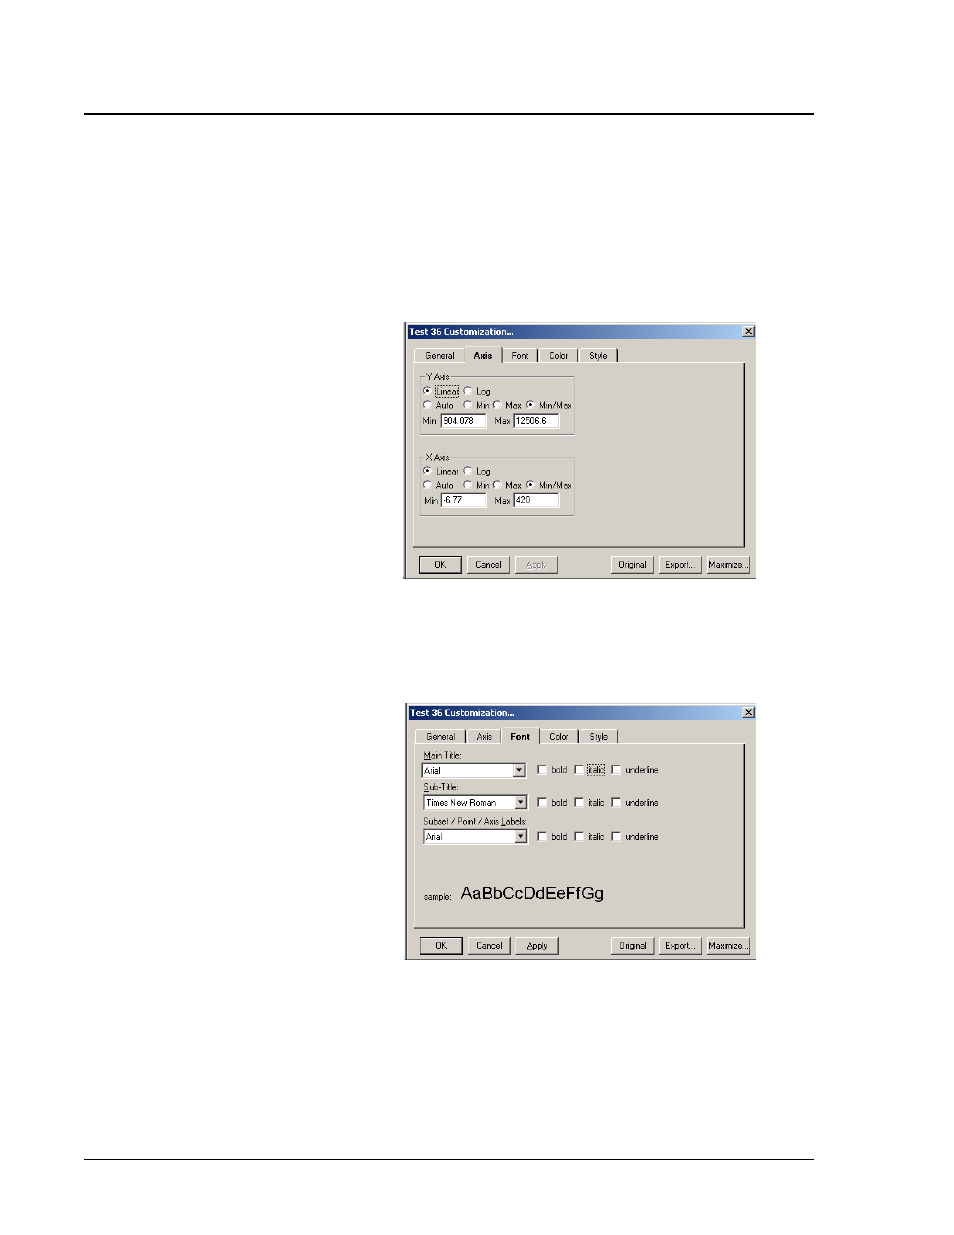
Axis Tab—Use the Axis tab to change your X axis and Y axis
values and specify whether to display them as linear or log. If
you select Log, use “Auto” or ensure that the “Min” value is
greater than zero. See Figure 5-48.
Figure 5-48. Customization Dialog Box—Axis Tab
•
Font Tab—Use the Font tab to change the appearance of the
fonts that appear in the Main Title, Sub Title, and Subset/ Point/
Axis Label boxes. The bottom of the dialog box displays a
sample of the font as you select it. See Figure 5-49.
Figure 5-49. Customization Dialog Box—Font Tab
•
Color Tab—Use the Color tab to define the various color
parameters on the analysis graph. See Figure 5-50.
Desk Foreground: this is the color that is used when placing
text onto the Desk Background. It includes the main title, sub
title, subset/point labels, grid numbers.