Luminex 100 IS Version 2.3 User Manual
Page 121
x
MAP Technology
Using Luminex 100 IS 2.3 Software
PN 89-00002-00-072 Rev. C
5 - 79
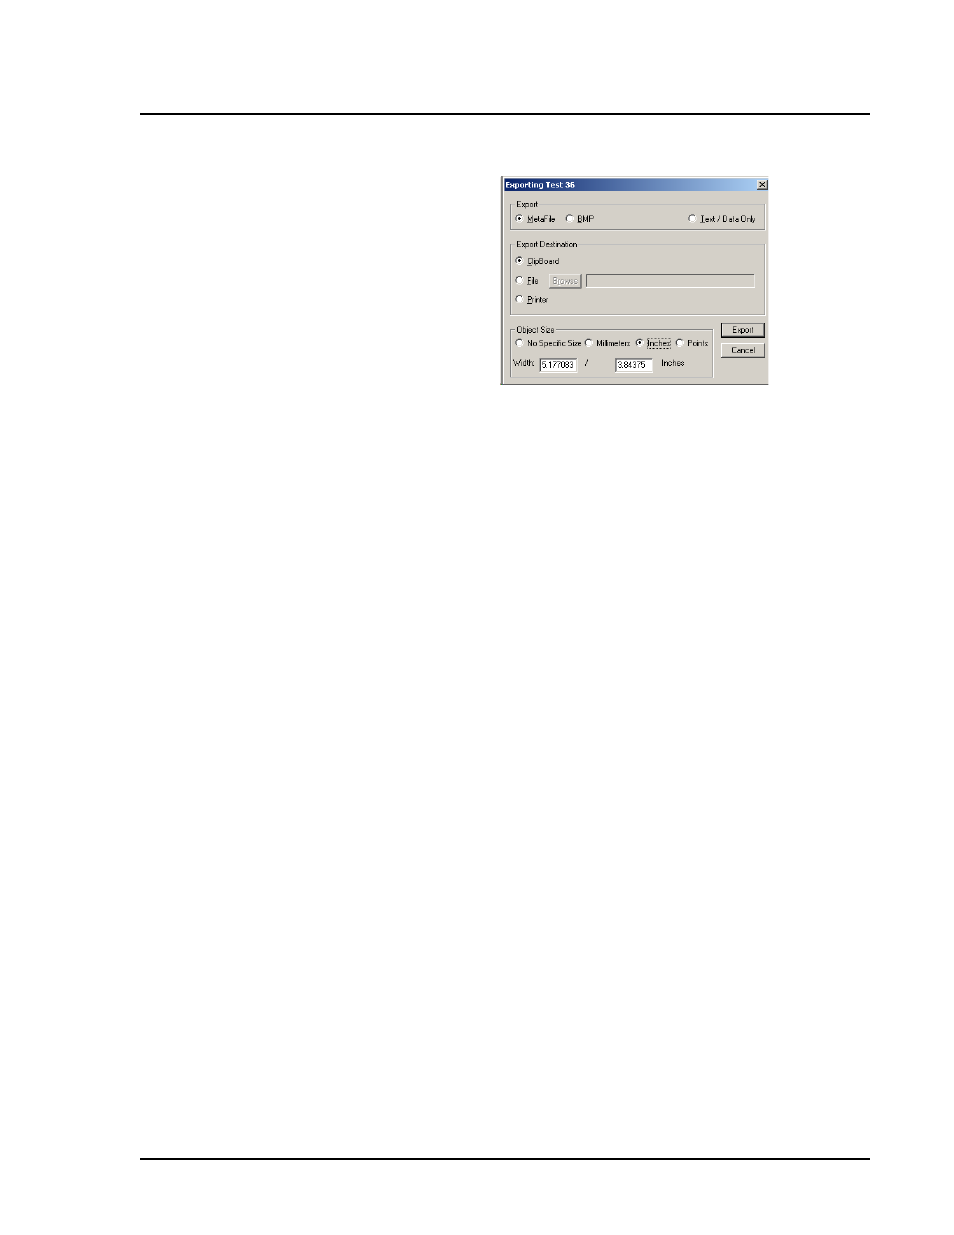
Figure 5-47. Exporting Dialog Box
Maximize: Click to maximize the graph to full screen. Restore
to original size by pressing Escape on the keyboard or by click-
ing in the title bar.
Customization dialog box tabs:
•
General Tab—Use this tab to define general parameters. See
Figure 5-46.
Main and Sub Titles: These edit-boxes allow you to add, edit,
or delete these titles. If no title is present, you can enter one.
Delete all characters from a title to remove it.
Viewing Style: The Graph supports three viewing styles:
Color
Monochrome
Monochrome with Symbols
This customization allows you to quickly adjust the image to
best suit printing on a monochrome printer. If you include
fewer than four subsets in a graph, then the Monochrome set-
ting will probably be the best choice. If four or more subsets
are included in the graph, then Monochrome with Symbols will
help distinguish the different subsets.
Font Size: The Graph supports three font sizes, Large,
Medium, and Small. When printing the graph, a font size of
Medium or Small is suggested. On occasion the graph may
automatically reduce the size of the font to produce a higher
quality image.
Show Annotations: Currently, this feature is not used. This
check box allows you to remove or add the annotations from
the image.
Numeric Precision: When exporting text and data from the
Export Dialog, you can define the number of decimal posi-
tions at 0, 1, 2, or 3.
Grid Lines: The Graph can contain vertical grid lines, horizon-
tal grid lines, both vertical and horizontal grid lines, or no grid
lines. Select the appropriate radio button.