Texas Instruments TITANIUM TI-89 User Manual
Page 756
Activities
756
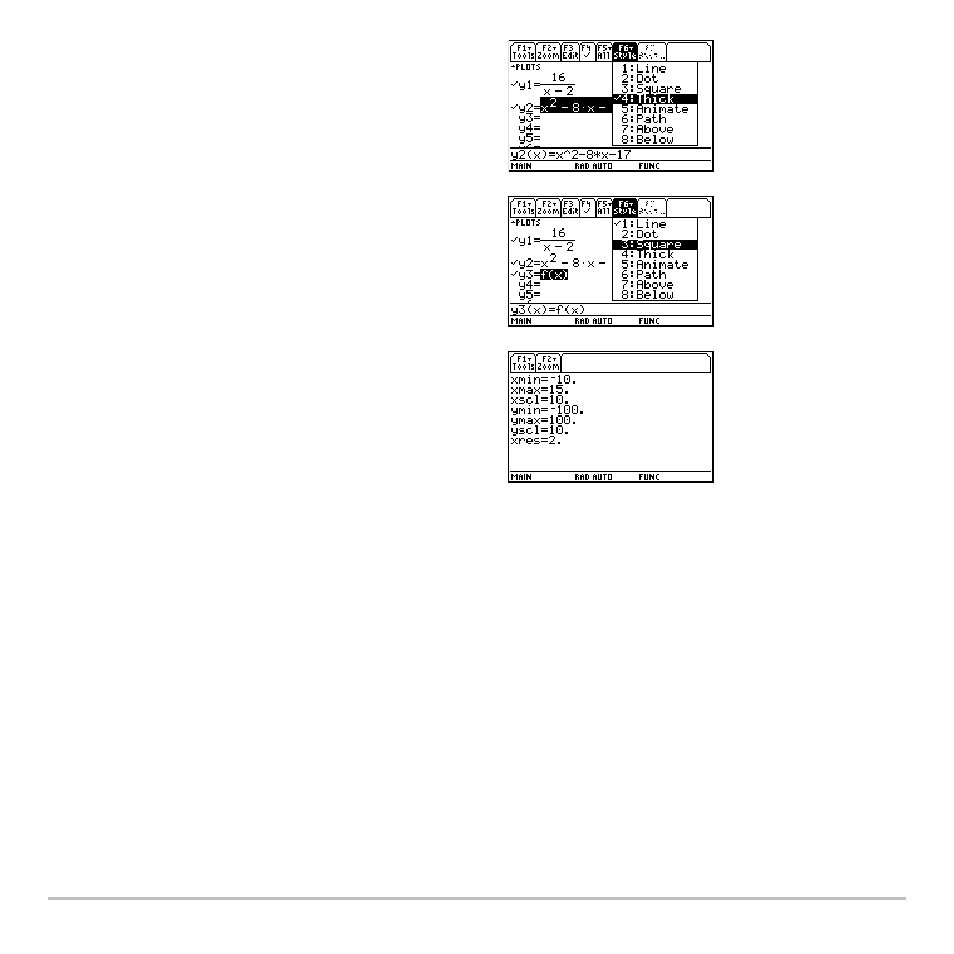
5. In the
Y= Editor
, select the thick graphing
style for
y2(x)
.
6. Add the original function
f(x)
to
y3(x)
and
select the square graphing style.
7. In the
Window Editor
, set the window
variables to:
x= [
L
10,15,10]
y= [
L
100,100,10]
8. Draw the graph.
Note:
Be sure the Graph mode is set to
Function.