Texas Instruments TITANIUM TI-89 User Manual
Page 135
Previews
135
6. Graph the solution using a
ZoomStd
viewing window.
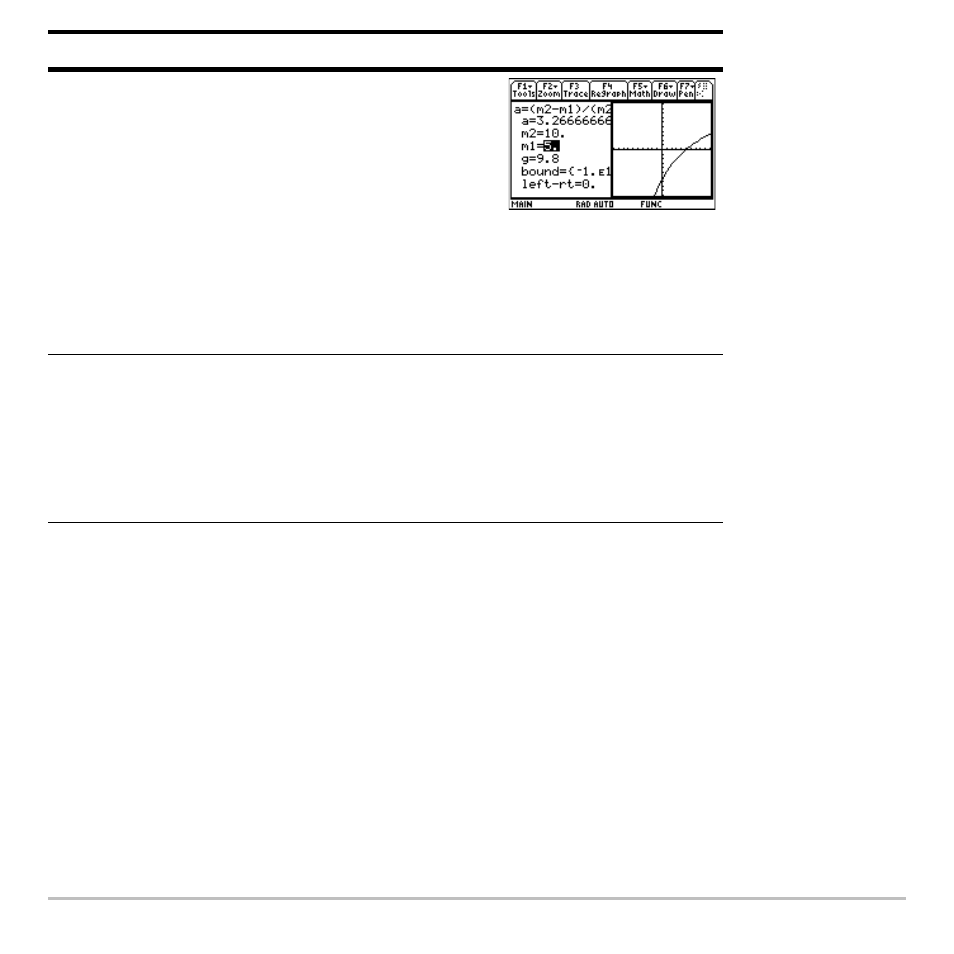
The graph is displayed in a split screen.
You can explore the graph by tracing,
zooming, etc.
The variable marked by the cursor
(unknown variable m1) is on the x axis,
and left-rt is on the y axis.
Press
… 3
7. Return to the
Numeric Solver
and exit the
split screen.
You can press
¸ or D to redisplay the
list of variables.
Press
2 a … 2
Steps and keystrokes
Display