Creating log charts, Editing data, Creating log charts -15 editing data -15 – SMC Networks EliteView 6.20 User Manual
Page 99: Table 7-5, Log chart information -15, 15 creating log charts
C
HART
M
ANAGER
U
TILITY
7-15
Creating Log Charts
Open the Chart Manager utility either from the Utility menu in the main EliteView program or from the Program
Manager. Click on Open under the File menu and select a dBase file (*.dbf) that was generated by the Log Manager.
Names for log files are based on the time the log file was generated, using a format of hhmmss (hh:hour,
mm:minutes, ss:seconds). Information displayed in the log chart includes the following items:
Editing Data
The significant parameter displayed under the data summary chart and graphic display is the rate of change for the
recorded value. If there are inconsistencies or extreme values for the rate that adversely affect your data summary
or log charts, you can easily adjust these values. Using the edit cursor, double-click on any cell under the Rate
column and change the recorded value. Remember that you can only change values for rate.
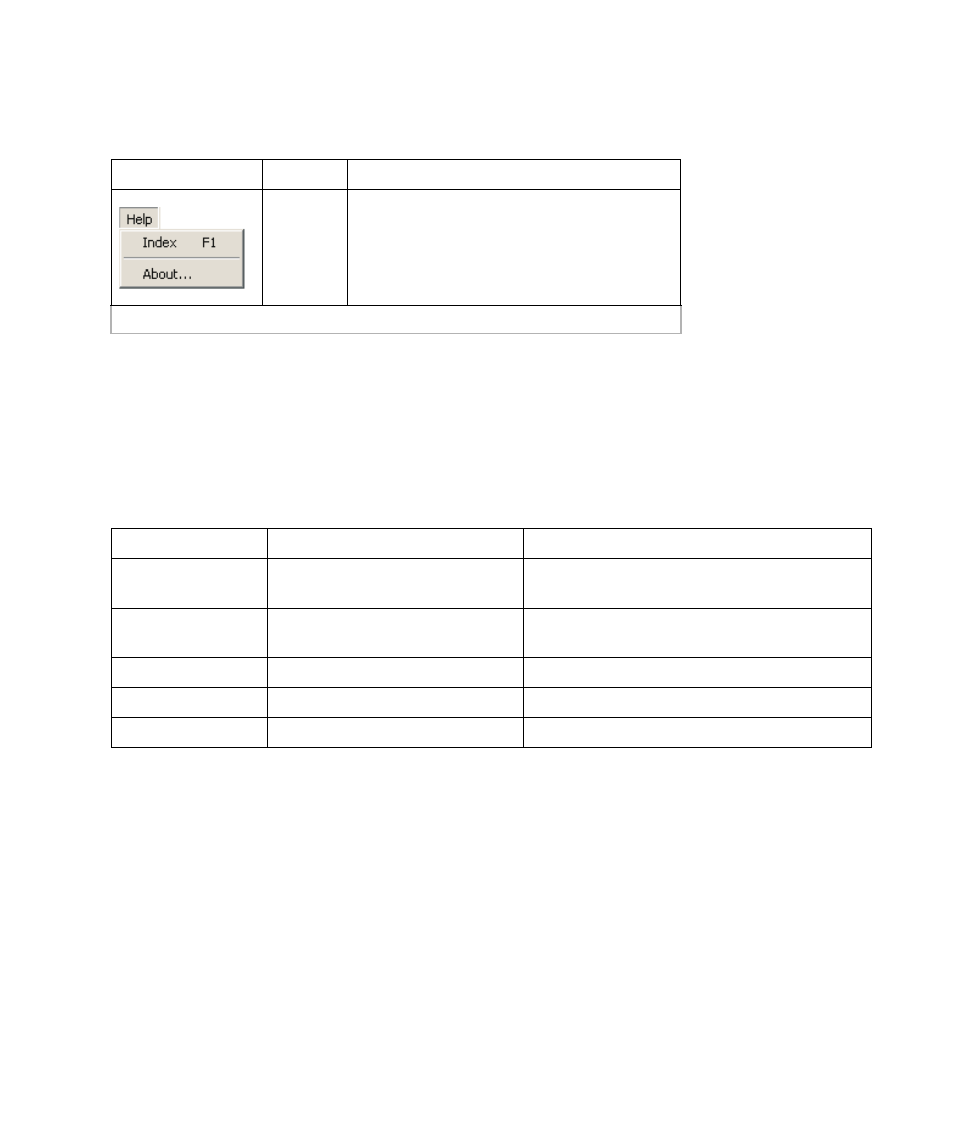
Help
Help Facility – Access detailed help information
about the Chart Manager.
* Window - indicates the windows for which this menu is active.
Table 7-5 Log Chart Information
Parameter
Example
Description
Date
20050322
Date this event was recorded. Format for date is
yyyymmdd (yyyy:year, mm:month,dd:day).
Time
165506
Time this event was recorded. Format for time is
hhmmss (hh:hour, mm:minute, ss:second).
Difference
1086
Difference in value for consecutive events.
Interval
5
Time between consecutive events.
Rate
217
Rate of change in recorded value per second
Table 7-4 Chart Manager Menu Definitions
Menu
Label
Description