Displaying graphic charts, Displaying graphic charts -17 – SMC Networks EliteView 6.20 User Manual
Page 101
C
HART
M
ANAGER
U
TILITY
7-17
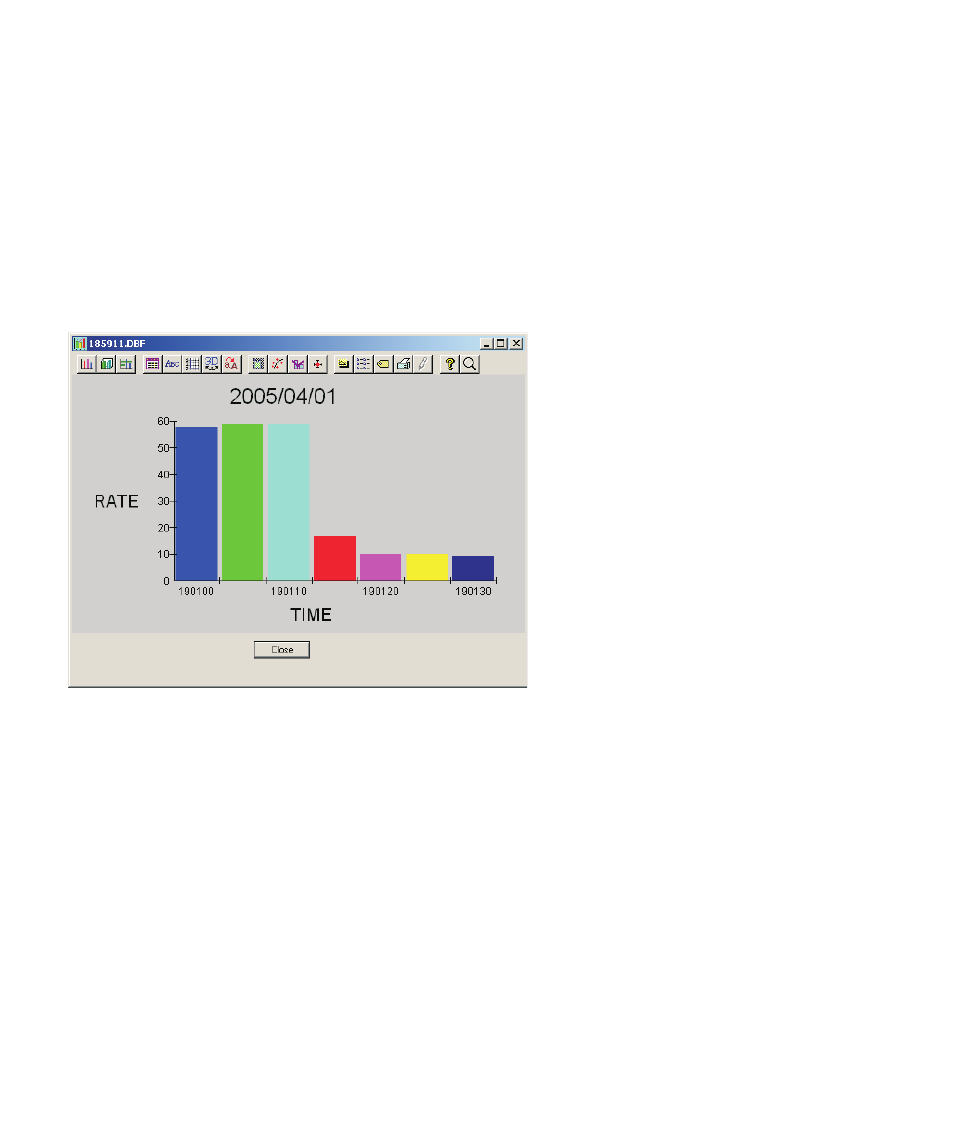
Displaying Graphic Charts
Graphic displays are generally more informative than a simple numeric listing. The Chart utility makes it easy for
the user to display either raw or summarized data in various graphic formats. To draw a graph of a specific range,
select the data to be displayed by positioning the cursor over the first entry you want to display, then holding down
the left mouse button, drag the cursor to the last process in the required range. The selected block will be
highlighted. To view the graph of the highlighted range click Graph on the menu bar. The default graph is a bar
chart as shown in the figure below.
See also other documents in the category SMC Networks Computer Accessories:
- D-P5DW (1 page)
- SMC TigerStack III SMC6824MPE (570 pages)
- 100 (90 pages)
- System 5000 (80 pages)
- D-H7A1 (1 page)
- D-F8B Series (2 pages)
- ES4704BD (2 pages)
- SMC Tiger 10/100 SMC6110L2 (2 pages)
- SMC6708L2 INT (2 pages)
- SMC Tiger 10/100 SMC6128PL2 (664 pages)
- TIGERSWITCH SMC8624T (80 pages)
- SMC EZ Connect SMCUSBH7 (2 pages)
- SMC Tiger 10/100/1000 SMC8124PL2 (2 pages)
- 10G (80 pages)
- 24/16 (31 pages)
- EZ Net 24SW EZNET-24SW (2 pages)
- SMC TigerStack SMC6248M (522 pages)
- SMC-EZ1026DT (2 pages)
- SMC TigerStack 1000 SMC8724M (592 pages)
- SMC TigerCard 10G (86 pages)
- SMC TigerStack 1000 SMC8728L2 (2 pages)
- SMC-EZ108DT (2 pages)
- D-R K Series (8 pages)
- Reed Switch Solid State Switches (27 pages)
- TigerAccess SMC7816VSW (962 pages)
- 100BASE-TX (384 pages)
- TIGERSTACK II SMC8926EM (76 pages)
- SMC6152L2 (2 pages)
- SMC Tiger 10/100 SMC6128L2 (606 pages)
- ETHERNET/IP EX500-AP -S (19 pages)
- SMCGS16-Smart (56 pages)
- SMC TigerAccess SMC7824M/FSW (748 pages)
- TigerStack 100 1000BASE-X (178 pages)
- SMC-EZ1016DT (2 pages)
- VDSL2 (96 pages)
- SMC1016FDT (4 pages)
- SMC TigerStack 1000 SMC8748ML3 (2 pages)
- TigerSwitch 100 (334 pages)
- SMC EZ 10/100/1000 SMCGS8P-Smart (366 pages)
- Edge-core ES4710BD (2 pages)
- SMC TigerAccess SMC7824M/ESW (104 pages)
- SMC EZ Stack 10/100 SMC5216 (2 pages)
- 10/100 (86 pages)
- SMCRPS600W* (78 pages)
- FY100 (22 pages)