Specifi cations – Magnum Energy MS-AEJ Series User Manual
Page 44
© 2007 Magnum Energy Inc
Page 38
Specifi cations
M S 4 0 2 4 A E E ffic ie n c y G ra p h
70%
73%
75%
78%
80%
83%
85%
88%
90%
93%
95%
98%
100%
0
500
1000
1500
2000
2500
3000
3500
4000
4500
Po w er (VA )
Effi
ci
en
cy
(Pe
rc
en
ta
ge
)
M S 4 4 4 8 A E E ffic ie n c y G ra p h
70%
73%
75%
78%
80%
83%
85%
88%
90%
93%
95%
98%
100%
0
500
1000
1500
2000
2500
3000
3500
4000
4500
Po w er (VA )
Effi
ci
en
cy
(Pe
rc
en
ta
ge
)
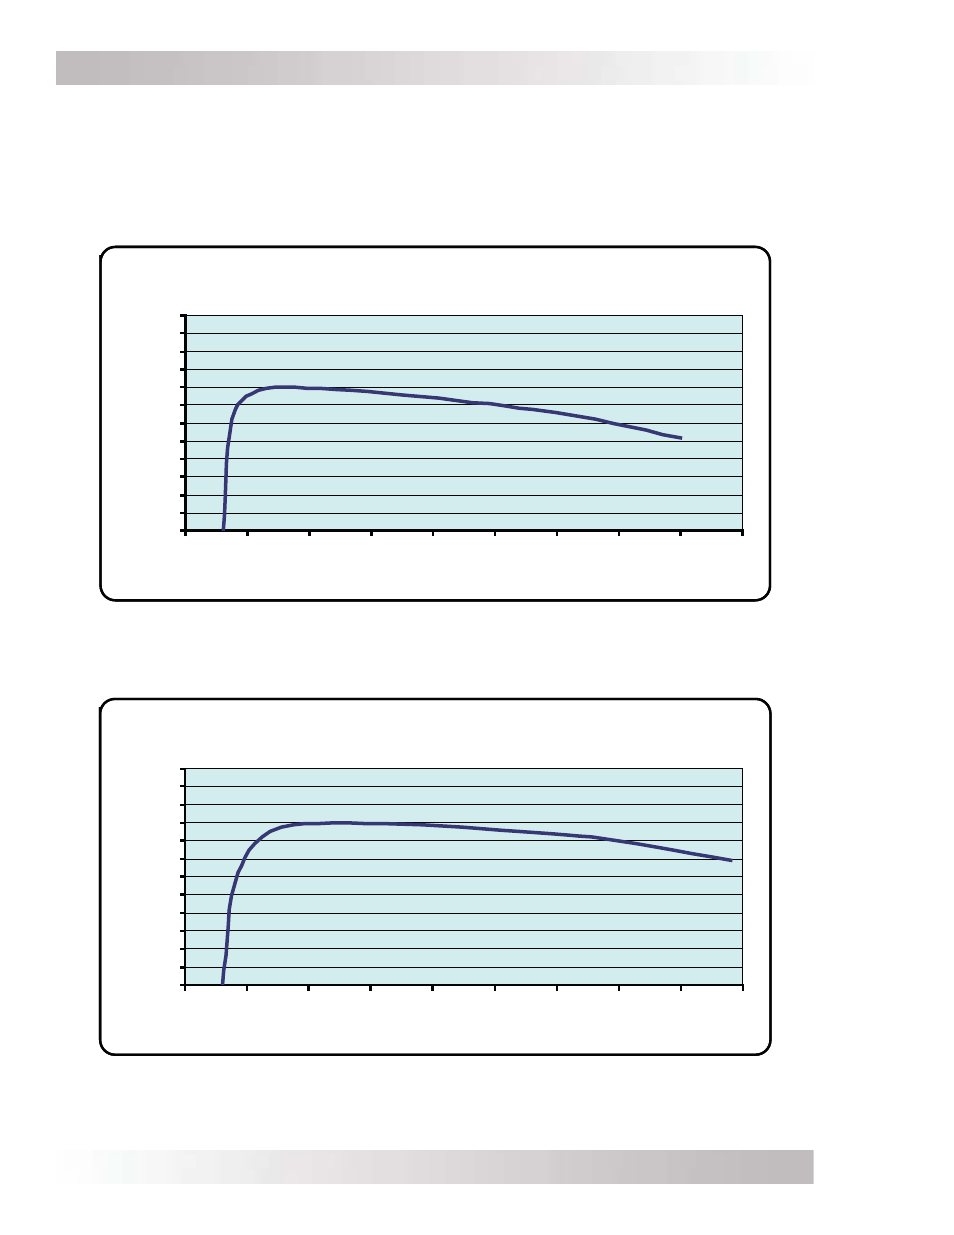
Figure 5-2, MS4448AE Effi ciency Chart
Figure 5-1, MS4024AE Effi ciency Chart
5.1 Effi ciency Graphs
The following curves are plotted to show the MS-AE series effi ciency over the inverter’s power
range and is displayed as a percentage.
These graphs represent a typical inverter’s effi ciency while operating resistive loads. Motors and
other inductive loads run less effi ciently due to the impact of power factor losses.