4 viewing sensor status – K-Patents PR-21-S User Manual
Page 45
5 Startup and use
39
that no values can be changed through this menu. To be able to make changes,
CALIBRATION
must be selected from the main menu.
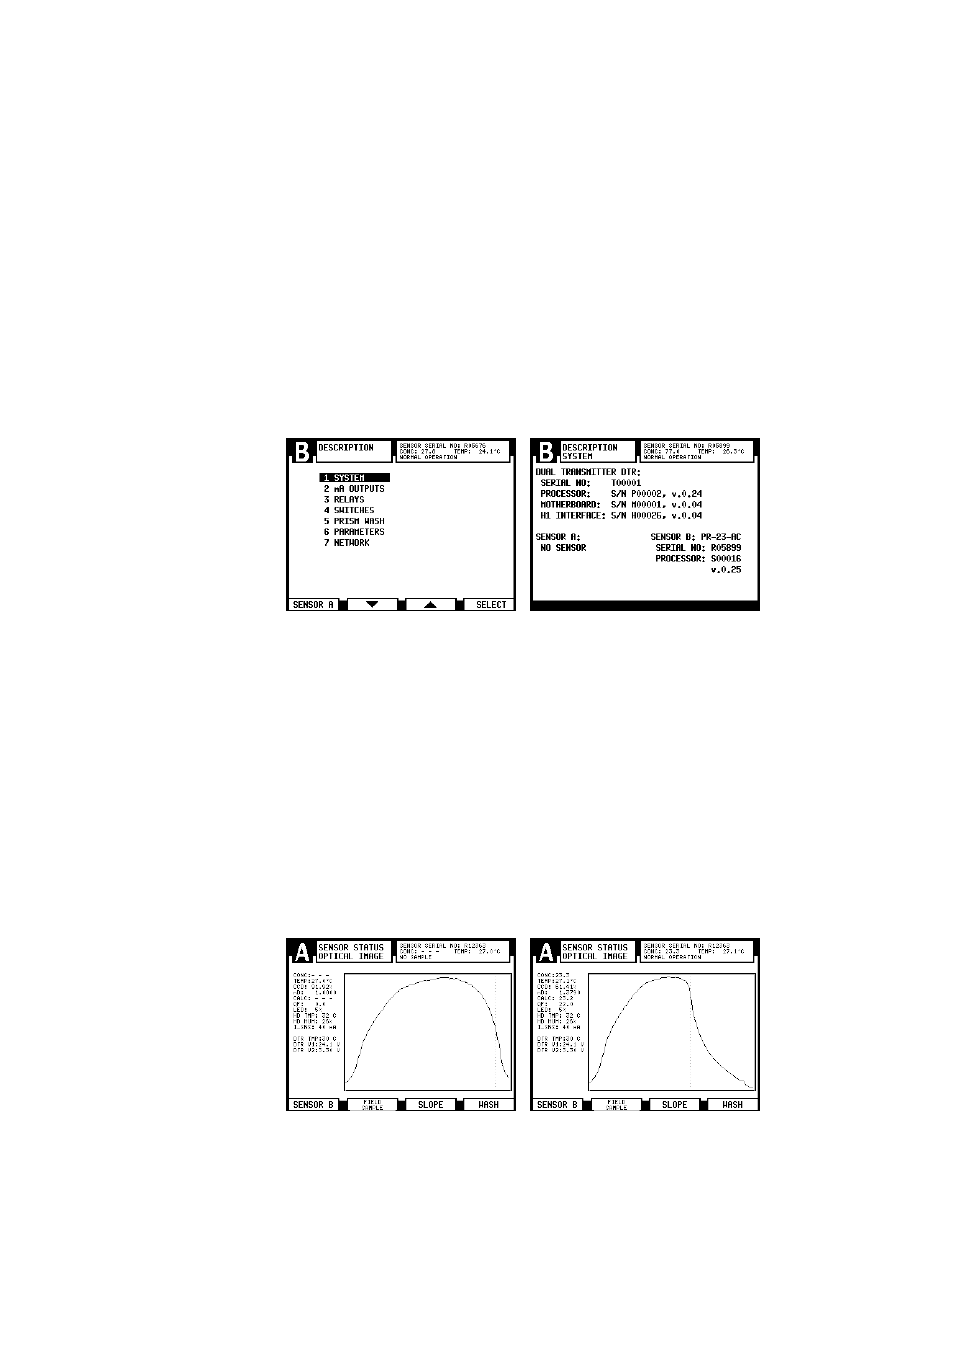
The Description menu (Figure 5.5) leads to the following information:
1.
SYSTEM
: See Figure 5.5, right side.
2.
mA OUTPUTS
: See Section 6.5.1, “Configuring mA outputs”
3.
RELAYS
: See Section 6.3, “Configuring relays”.
4.
SWITCHES
: See Section 6.4, “Configuring input switches”.
5.
PRISM WASH
: See Sections 6.3 and 6.7, “Configuring prism wash”.
6.
PARAMETERS
: See Section 6.6, “Calibrating the concentration measurement”.
7.
NETWORK
: The Ethernet address and card ID of the DTR. See Section 11, “Ethernet
connection specification”.
Figure 5.5
System description
5.4 Viewing sensor status
Select
SENSOR STATUS
at the Main menu.
5.4.1 Optical image
With the image detection algorithm the Optical image graph (See Figure 2.2 for
explanation) should look like Figure 5.6, right side. The vertical dotted line indi-
cates the position of the shadow edge. For empty pipe, the optical image looks like
Figure 5.6, left side. The soft key
SLOPE
leads to a graph (Figure 5.7) showing the
slope (or first differential) of the optical image graph in Figure 5.6.
Note: In case there is no signal from the sensor, the image field is crossed over.
Empty pipe
Normal conditions
Figure 5.6
Typical optical images