2 principle of measurement – K-Patents PR-21-S User Manual
Page 12
6
PR-21-S instruction manual
1.2 Principle of measurement
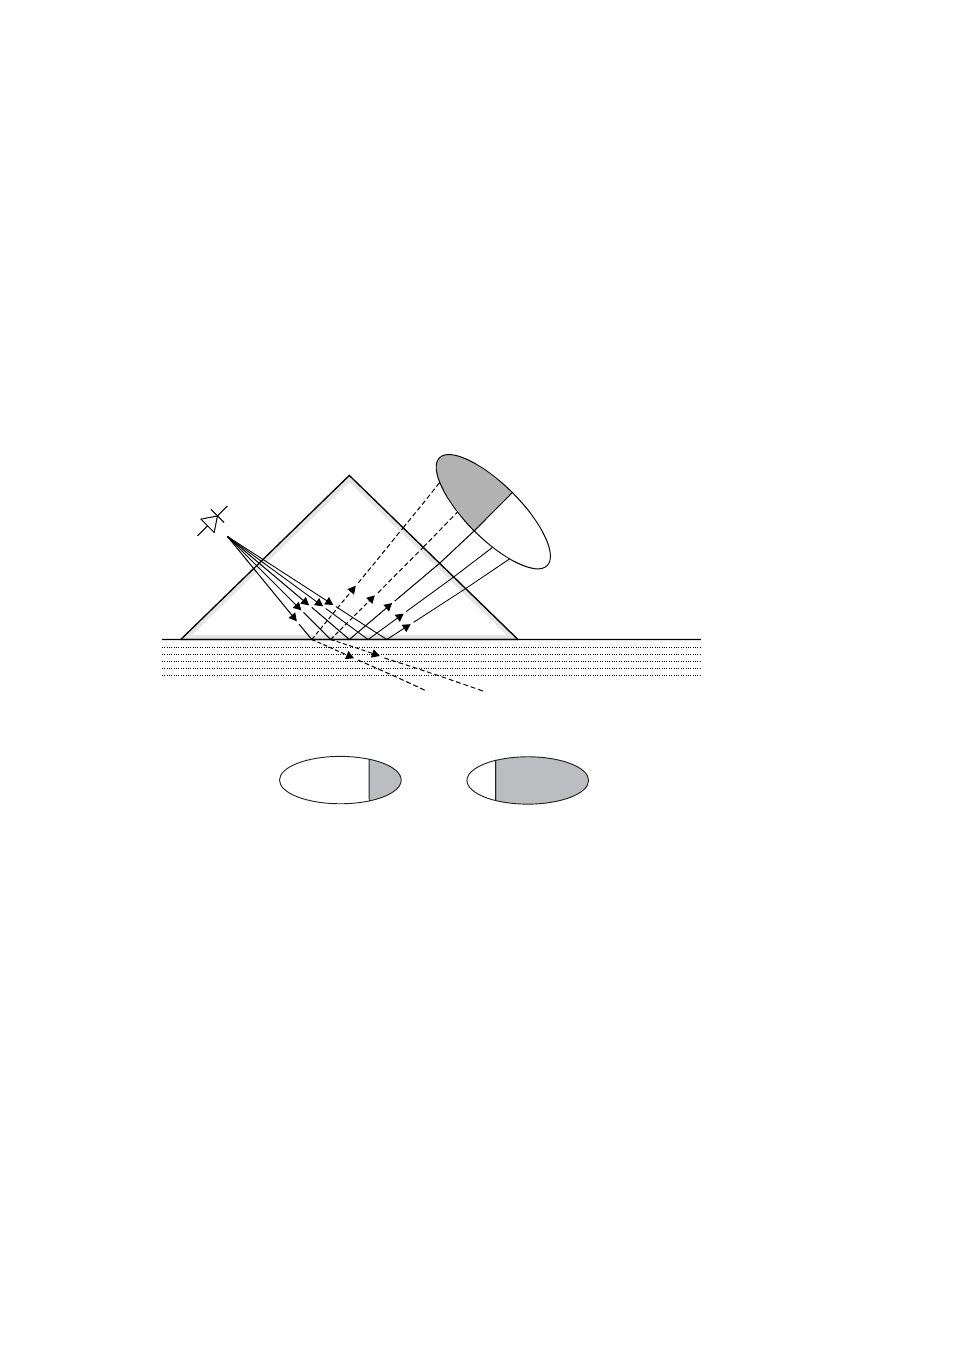
The K-Patents Process Refractometer determines the refractive index (R.I) of the
process solution by measuring the critical angle of refraction. The light from a light
source (L) (Figure 1.8) is directed against the interface between a prism (P) and the
process solution (S). The light rays meet this surface at different angles. The reflected
rays form an image (ACB), where (C) is the position of the critical angle ray. The rays at
(A) are totally reflected at the interface, the rays at (B) are partially reflected and par-
tially refracted into the process solution. In this way the optical image is divided into
a light area (A) and a dark area (B). The position of the borderline (C) between the ar-
eas shows the value of the critical angle and thus of the refractive index of the process
solution. The refractive index normally increases with increasing concentration.
INSTRUCTION MANUAL FOR K-PATENTS PR-01-S (-AX/FM/CS)
DOCUMENT/REVISION No. INM 1/14
Effective: May 15, 2009
7
2.3. PRINCIPLE OF MEASUREMENT
The K-Patents Process Refractometer determines the refractive index (R.I) of the process solution by
measuring the critical angle of refraction. The light from a light source (L) (Figure 2.30) is directed against
the interface between a prism (P) and the process solution (S). The light rays meet this surface at different
angles. The reflected rays form an image (ACB), where (C) is the position of the critical angle ray. The
rays at (A) are totally reflected at the interface, the rays at (B) are partially reflected and partially refracted
into the process solution. In this way the optical image is divided into a light area (A) and a dark area (B).
The position of the borderline (C) between the areas shows the value of the critical angle and thus of the
refractive index of the process solution. The refractive index normally increases with increasing
concentration.
B
C
A
S
P
L
Figure 2.30
Refractometer principle.
Figure 2.31
Optical images.
From this follows that the optical image changes with the process solution concentration as shown in
Figure 2.31. The optical image is converted to an electric signal by an image detector.
By this method the concentration of the solution is measured. The color of the solution, gas bubbles or
undissolved particles do not interfere with the result.
Figure 1.8
Refractometer principle
2
PR-23 instruction manual
1.2 Principle of measurement
The K-Patents inline refractometer sensor determines the refractive index n
D
of the
process solution. It measures the critical angle of refraction using a yellow LED light
source with the same wavelength (580 nm) as the sodium D line (hence n
D
). Light
from the light source (L) in Figure 1.2 is directed to the interface between the prism
(P) and the process medium (S). Two of the prism surfaces (M) act as mirrors bending
the light rays so that they meet the interface at different angles.
L
P
M
M
S
A
C
B
Figure 1.2
Refractometer principle
The relected rays of light form an image (ACB), where (C) is the position of the critical
angle ray. The rays at (A) are totally internally relected at the process interface, the
rays at (B) are partially relected and partially refracted into the process solution. In
this way the optical image is divided into a light area (A) and a dark area (B). The
position of the shadow edge (C) indicates the value of the critical angle. The refractive
index n
D
can then be determined from this position.
The refractive index n
D
changes with the process solution concentration and tempera-
ture. When the concentration changes, the refractive index normally increases when
the concentration increases. At higher temperatures the refractive index is smaller
than at lower temperatures. From this follows that the optical image changes with
the process solution concentration as shown in Figure 1.3. The color of the solution,
gas bubbles or undissolved particles do not affect the position of the shadow edge (C).
B
B
C
C
A
A
Low concentration
High concentration
Figure 1.3
Optical images
Figure 1.9
Optical images
From this follows that the optical image changes with the process solution concentra-
tion as shown in Figure 1.9. The optical image is converted to an electric signal by an
image detector. By this method the concentration of the solution is measured. The
color of the solution, gas bubbles or undissolved particles do not interfere with the
result.